arrow
arrow
arrow
The bar graph given below shows the number of male voters (P) and female voters (Q) in 5 states. Which of the following statement is correct? I.
Question

The bar graph given below shows the number of male voters (P) and female voters (Q) in 5 states.

Which of the following statement is correct?
I. In state S2, female voters are 80 more than male voters.
II. In state S4, male voters are 50 more than female voters.

A.

Only I

B.

Only II

C.

Both I and II

D.

Neither I nor II

Correct option is C

Given:
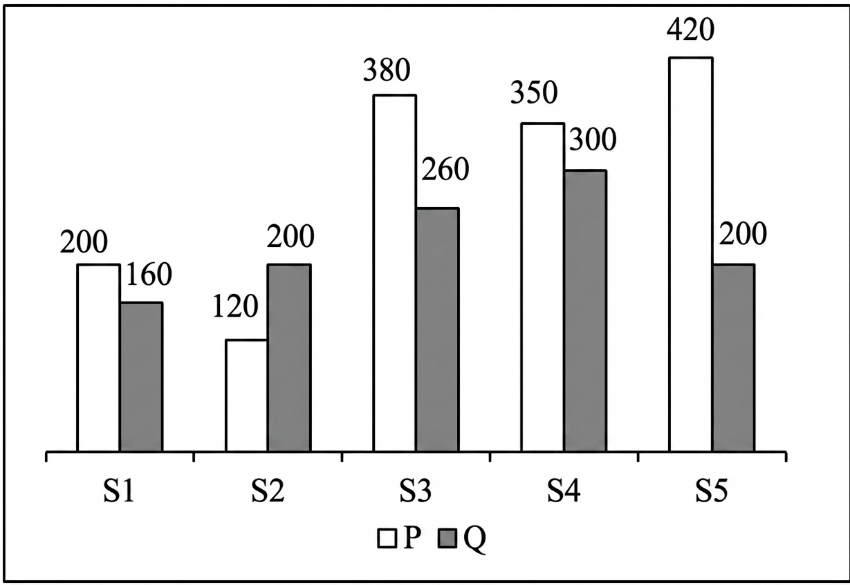
Bar graph showing male (P) and female (Q) voters in 5 states.
Formula Used:
Difference = Larger Value - Smaller Value
Solution:
Check Statement I: In state S2,
Female voters - Male voters = 200 - 120 = 80
So, Statement I is correct.
Check Statement II: In state S4, 
Male voters - Female voters = 350 - 300 = 50
So, Statement II is correct.
Therefore, both statements are correct.
Final Answer
So the correct answer is (c)

Free Tests

Free
Must Attempt

SSC GD PYP (Held on 4 Feb 2025 S1)

languageIcon English
  • pdpQsnIcon80 Questions
  • pdpsheetsIcon160 Marks
  • timerIcon60 Mins
languageIcon English
Free
Must Attempt

Hindi Section Test 1

languageIcon English
  • pdpQsnIcon20 Questions
  • pdpsheetsIcon40 Marks
  • timerIcon12 Mins
languageIcon English
Free
Must Attempt

SSC GD Constable Full Mock Test 1

languageIcon English
    0
  • pdpsheetsIcon160 Marks
  • timerIcon60 Mins
languageIcon English

Similar Questions

test-prime-package

Access ‘SSC MTS (Similar PYPs)’ Mock Tests with

  • 60000+ Mocks and Previous Year Papers
  • Unlimited Re-Attempts
  • Personalised Report Card
  • 500% Refund on Final Selection
  • Largest Community
students-icon
399k+ students have already unlocked exclusive benefits with Test Prime!
Our Plans
Monthsup-arrow