Correct option is C
The correct answer is: (3) B and C
Explanation:
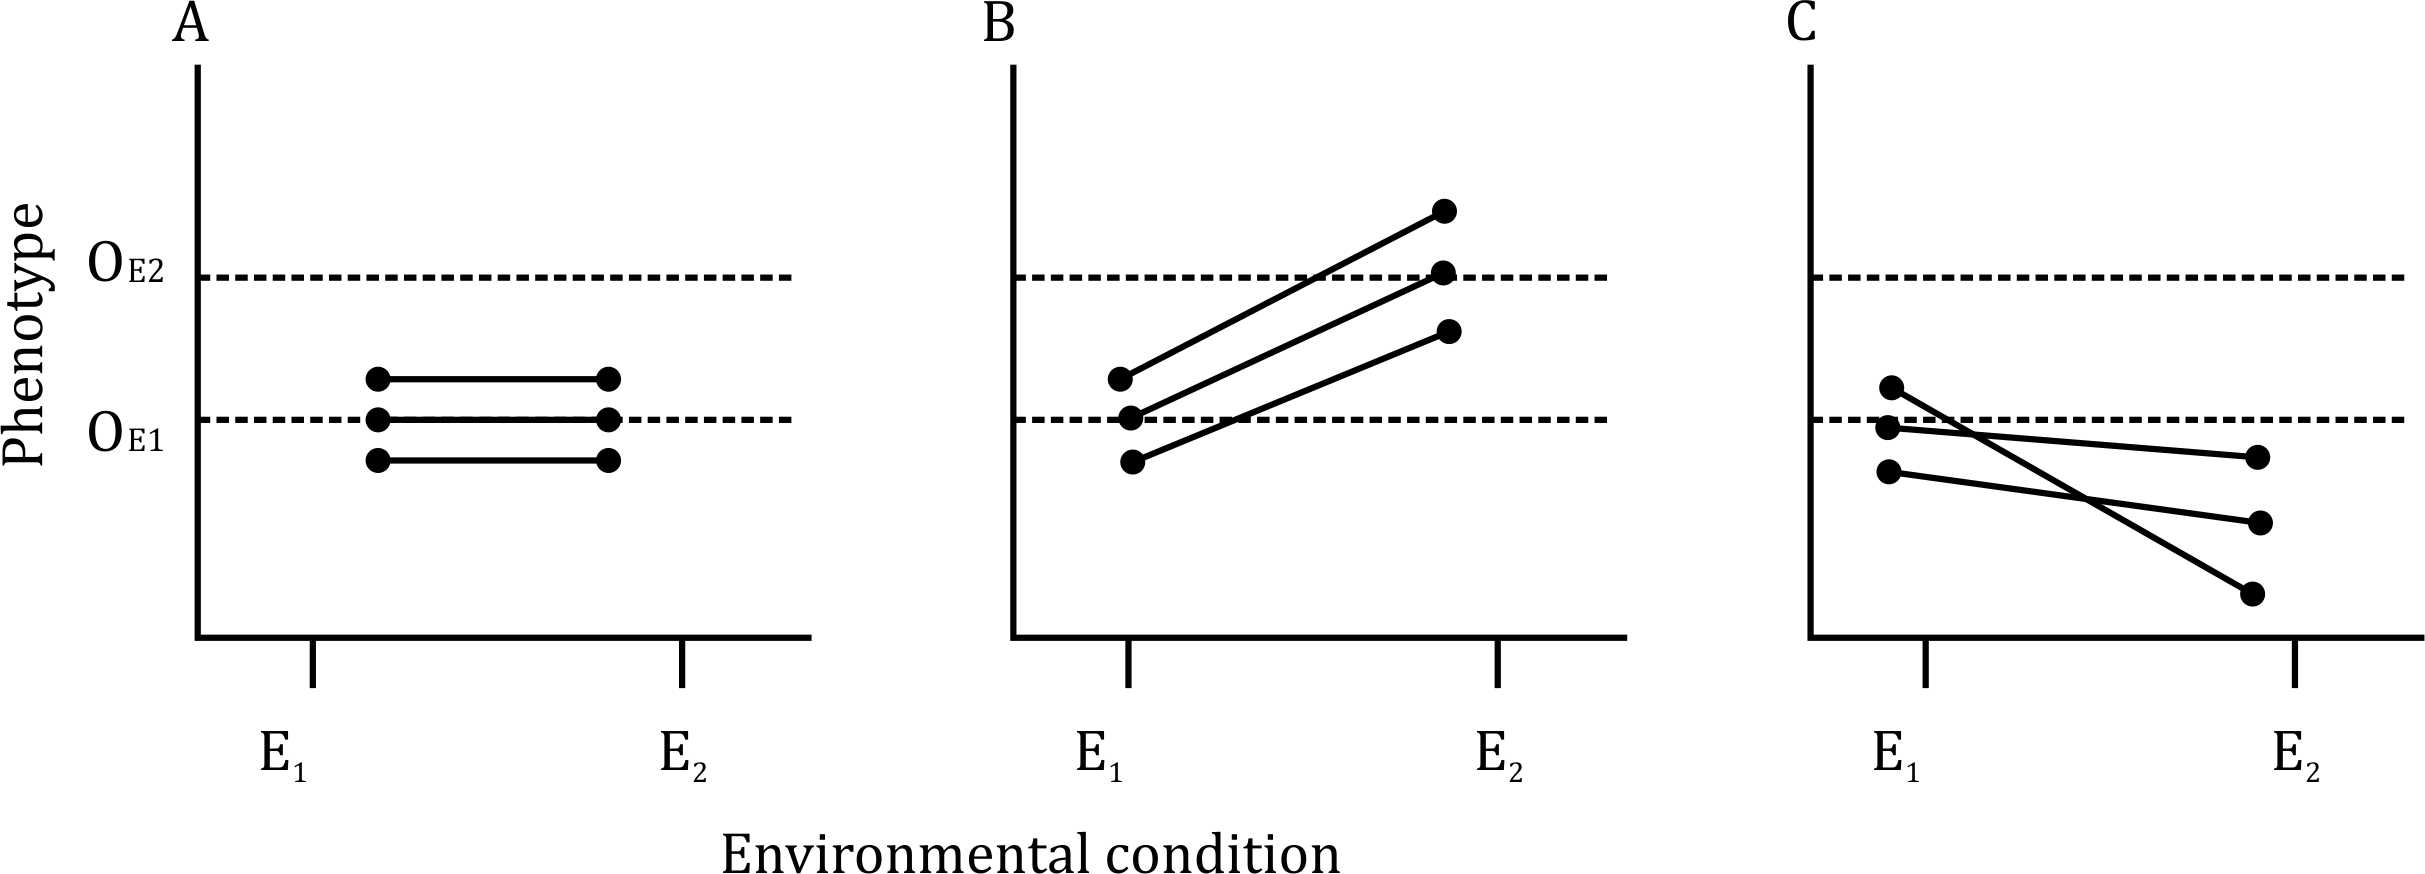
Phenotypic plasticity refers to the ability of an organism to exhibit different phenotypes in response to different environmental conditions. This means that changes in the environment (like E1 and E2) can lead to observable changes in the phenotype of an organism.
Graph B: This graph demonstrates phenotypic plasticity as there is a clear shift in phenotype under the different environmental conditions (E1 and E2), suggesting that the organism is able to express different phenotypes depending on the environment.
Graph C: This graph also represents phenotypic plasticity because while the phenotypes remain the same in both environments, the plot shows that no change in phenotype occurs even under the different conditions, which suggests that the organism is adapting and maintaining its phenotype in response to environmental stress. This is a form of phenotypic stability under different environments, which is still a part of phenotypic plasticity.
Graph A: This graph is not indicative of phenotypic plasticity, as there is no change in the phenotype across the two conditions. The absence of any variation between environments suggests a lack of plasticity.