Correct option is D
Concept:
Solution:
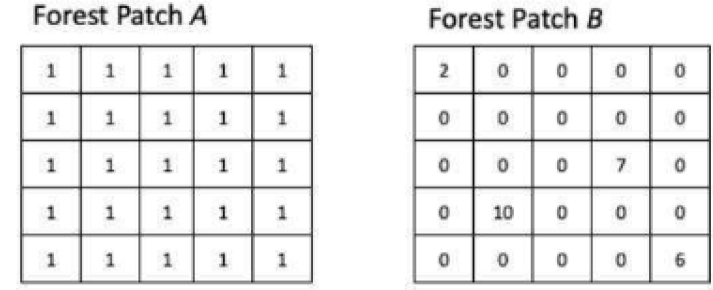
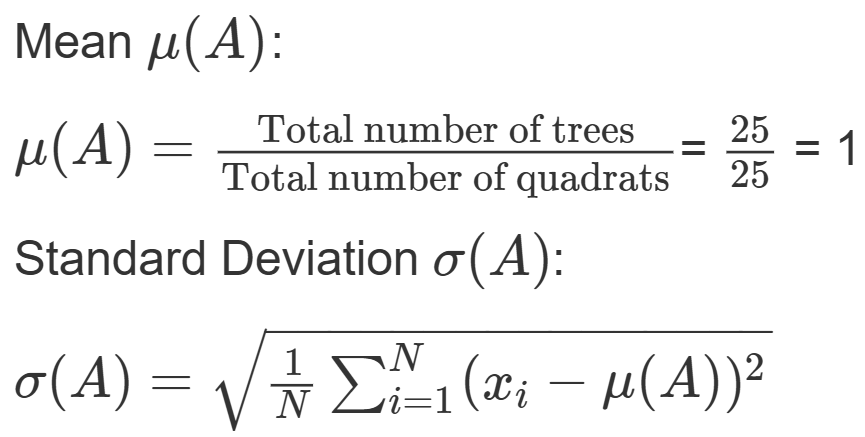
Forest Patch A:
There are 25 quadrats, each containing exactly 1 tree.
Mean (μA): Total number of trees is 25.
Mean is μ(A)=25/25=1.
Standard deviation (σA): Since all values are the same (1), the standard deviation is σ(A)=0.
Forest Patch B:
Quadrats contain the following numbers of trees: {2,0,0,0,0,0,0,7,0,10,0,0,0,6,0}
Mean (μB): Total number of trees is 2 + 7 + 10 + 6 = 25 .
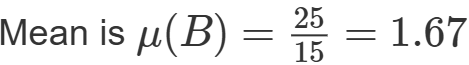
Standard deviation (σB): Since values vary greatly, the standard deviation σ(B)>0.
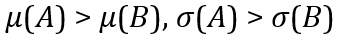
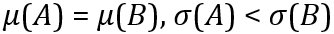
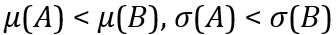
=> μ(A) and μ(B) are not equal.
=> The standard deviation in Patch B is higher due to the large variation in tree numbers.
Thus, Option (d) is correct.