arrow
arrow
arrow
Study the following pie chart and answer the question given below it. The following pie chart represents the percentage distribution for different
Question

Study the following pie chart and answer the question given below it.
The following pie chart represents the percentage distribution for different sectors. 

Find the angle subtended at the centre of the circle by the social services sector.

A.

70°

B.

45°

C.

46°

D.

58°

Correct option is D

Given:
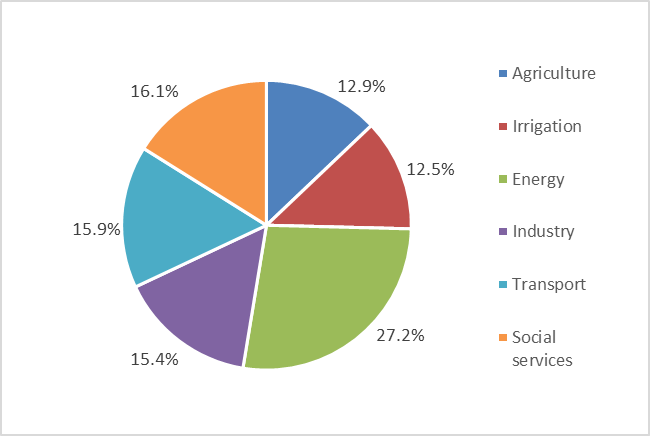
The pie chart represents the percentage allocation for various sectors. Each sector is represented by a different color and percentage.
Agriculture: 12.9%
Irrigation: 12.5%
Energy: 27.2%
Industry: 15.4%
Transport: 15.9%
Social Services: 16.1% 
Solution:
360° = (16.1 + 12.9 + 12.5 + 27.2 + 15.4 + 15.9)%
360° = 100%
1% = 3.6°
Angle subtended at the centre of the circle by the social services sector= 3.6° ×\times​ 16.1% = 57.96°
 = 58°

Free Tests

Free
Must Attempt

CBT-1 Full Mock Test 1

languageIcon English
  • pdpQsnIcon100 Questions
  • pdpsheetsIcon100 Marks
  • timerIcon90 Mins
languageIcon English
Free
Must Attempt

RRB NTPC Graduate Level PYP (Held on 5 Jun 2025 S1)

languageIcon English
  • pdpQsnIcon100 Questions
  • pdpsheetsIcon100 Marks
  • timerIcon90 Mins
languageIcon English
Free
Must Attempt

RRB NTPC UG Level PYP (Held on 7 Aug 2025 S1)

languageIcon English
  • pdpQsnIcon100 Questions
  • pdpsheetsIcon100 Marks
  • timerIcon90 Mins
languageIcon English

Similar Questions

test-prime-package

Access ‘RRB JE CBT-I’ Mock Tests with

  • 60000+ Mocks and Previous Year Papers
  • Unlimited Re-Attempts
  • Personalised Report Card
  • 500% Refund on Final Selection
  • Largest Community
students-icon
368k+ students have already unlocked exclusive benefits with Test Prime!
Our Plans
Monthsup-arrow