arrow
arrow
arrow
The pie chart given here shows expenditures incurred by a family on various items and their savings, which amount to Rs. 18,000 in a month. Study th
Question

The pie chart given here shows expenditures incurred by a family on various items and their savings, which amount to Rs. 18,000 in a month.
Study the chart and answer the question based on the pie chart.

How much more amount is spent on food than on housing? 

A.

Rs. 925

B.

Rs. 500

C.

Rs. 750

D.

Rs. 850

Correct option is C

Given:
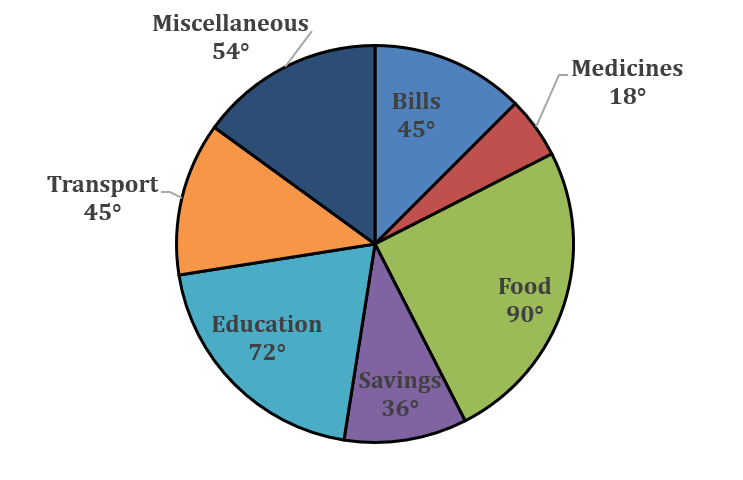
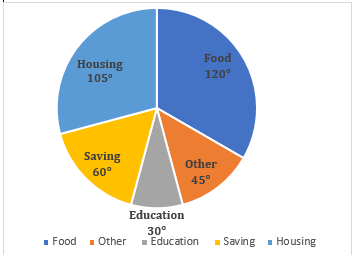
Total Amount = Rs 18,000
Solution:
360° = Rs. 18000
1° = Rs. 50
Then, portion spent on food = 120°
Portion spend on housing = 105°
Difference in amount spent (in degree) in food and housing = 120° - 105° = 15°
Required Difference = 15 × 50 = Rs 750.

test-prime-package

Access ‘IB ACIO’ Mock Tests with

  • 60000+ Mocks and Previous Year Papers
  • Unlimited Re-Attempts
  • Personalised Report Card
  • 500% Refund on Final Selection
  • Largest Community
students-icon
192k+ students have already unlocked exclusive benefits with Test Prime!

Free Tests

Free
Must Attempt

General Awareness Section Test 01

languageIcon English
  • pdpQsnIcon20 Questions
  • pdpsheetsIcon20 Marks
  • timerIcon8 Mins
languageIcon English
Free
Must Attempt

National Weekly Current Affairs Jun 2025 Practice Set 01

languageIcon English
  • pdpQsnIcon25 Questions
  • pdpsheetsIcon25 Marks
  • timerIcon15 Mins
languageIcon English
Free
Must Attempt

IB ACIO Grade-II Executive (Held on 17 Jan 2024 S1)

languageIcon English
  • pdpQsnIcon100 Questions
  • pdpsheetsIcon100 Marks
  • timerIcon60 Mins
languageIcon English