Correct option is A
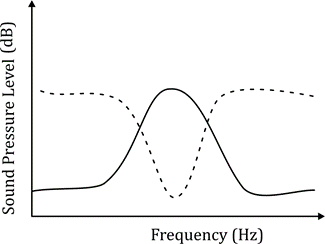
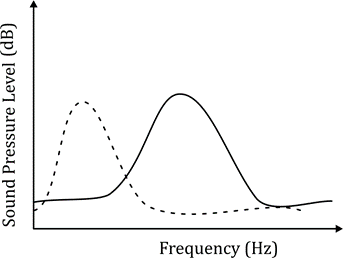
Ans. 1. The first figure (two curves intersecting at different frequencies)
The key idea here is the reproductive isolation mechanism described in the question. Here’s a more refined explanation:
The power spectrum (solid lines) shows the species-specific frequency where most of the male call energy is concentrated. The rest of the frequencies have less energy.
The hearing threshold curve (dashed lines) represents the sensitivity of females to different frequencies. Females are most sensitive to the species-specific frequency, meaning the hearing threshold at this frequency should be the lowest (or the curve should be closest to the power spectrum).
Now, let's break down the options:
Option 1: The first figure shows two curves intersecting at different frequencies, which means the hearing threshold (dashed line) for the female has two points where the sensitivity to different frequencies intersects with the power spectrum. This suggests that females might be sensitive to two distinct frequencies, one being the species-specific frequency and the other potentially being a background frequency. The fact that the curves intersect indicates that the female can distinguish between calls of different frequencies, helping her identify the correct species while ignoring others. This matches the idea of reproductive isolation, where females recognize their species' calls even in the presence of other, louder calls at different frequencies.
Option 2: A sharp peak for the species-specific frequency would indicate that the female is only sensitive to that frequency. While this makes sense for species-specific calls, it doesn’t fully explain the behavior of recognizing other frequencies, which could also be important in distinguishing between species. It doesn't match the dual-interaction nature of how females process different frequency calls.
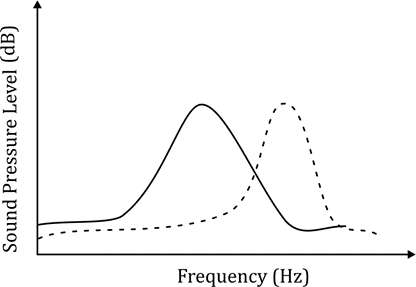
Option 3: Two peaks in the hearing threshold curve suggest that the female is equally sensitive to two frequencies, but this doesn’t align with the idea that she is specifically attuned to her species' frequency over others, which would be indicated by one dominant peak at the species-specific frequency.
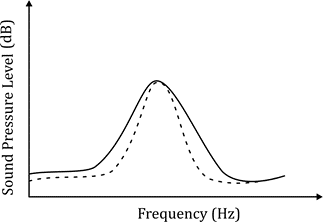
Option 4: A narrow peak for both the power spectrum and the hearing threshold curve could imply that the female is sensitive to a narrow frequency range. However, this would not explain the phenomenon where females need to ignore calls at other frequencies, as it does not fully capture the variation in frequencies that the female must distinguish between.
Conclusion:
The correct answer is Option 1, as the two intersecting curves suggest that females are capable of recognizing both the species-specific frequency and ignoring other calls based on their sensitivity to frequencies, which is crucial for reproductive isolation.
Information Booster:
Power Spectrum: This plot shows the distribution of sound energy across various frequencies in the male's call. The species-specific frequency carries the most energy, indicating the frequency the female is most sensitive to.
Hearing Threshold Curve: This curve indicates the sensitivity of the female to different frequencies. The intersection of the dashed and solid lines in Option 1 suggests the female can detect calls at different frequencies and is especially sensitive to the species-specific call.
Reproductive Isolation: This mechanism relies on females being able to identify the correct species-specific call while ignoring calls from other species. The dual curve intersection suggests that the female can distinguish between species' calls, even if other species' calls are louder