hamburger menu
All Coursesall course arrow
adda247
reward-icon
adda247
    arrow
    arrow
    arrow
    For CO, the contour plot of the molecular orbital which best represents the HOMO is
    Question

    For CO, the contour plot of the molecular orbital which best represents the HOMO is

    A.

    B.

    C.

    D.

    Correct option is B

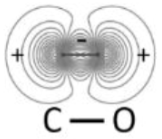
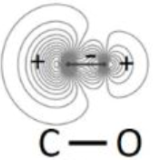
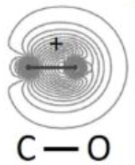
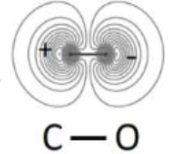
    ​A contour plot is a graphical technique for representing a 3-dimensional surface by plotting constant z slices, called contours, on a 2-dimensional format. That is, given a value for z, lines are drawn for connecting the (x,y) coordinates where that z value occurs.

    Contour plots are available in most general purpose statistical software programs. They are also available in many general purpose graphics and mathematics programs. These programs vary widely in the capabilities for the contour plots they generate. Many provide just a basic contour plot over a rectangular grid while others permit color filled or shaded contours.

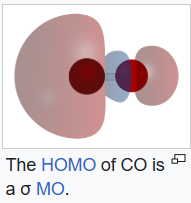
    As a ligand, CO binds through carbon, forming a kind of triple bond. The lone pair on the carbon atom donates electron density to form a M-CO sigma bond. The two π* orbitals on CO bind to filled metal orbitals.

    Similar Questions

    test-prime-package

    Access ‘CSIR NET Chemical Sciences’ Mock Tests with

    • 60000+ Mocks and Previous Year Papers
    • Unlimited Re-Attempts
    • Personalised Report Card
    • 500% Refund on Final Selection
    • Largest Community
    students-icon
    368k+ students have already unlocked exclusive benefits with Test Prime!
    Our Plans
    Monthsup-arrow