arrow
arrow
arrow
Which one of the following figures correctly shows the variation of electric potential V (in units of ) and electric field E (in units of ) with dista
Question

Which one of the following figures correctly shows the variation of electric potential V (in units of ) and electric field E (in units of ) with distance r for a point charge Q?

A.

B.

C.

D.


Correct option is D

Correct answer is D
Concept:
The variation of electric potential {V) and electric field {E) for a point charge Q with distance r can be expressed as:
Electric potential, V = (Q/4πε0) × (1/r)
Electric field, E = (Q/4πε0) × (1/r2)
Here:
ε0 is the permittivity of free space.
r is the distance from the point charge Q.Q
Explanation:
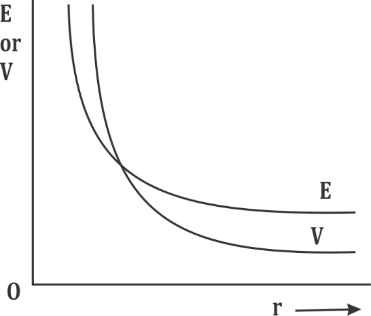
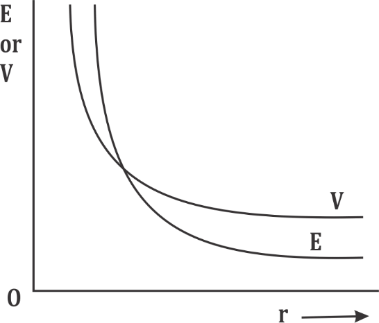
The electric potential {V) decreases inversely with r, while the electric field {E) decreases inversely with r2.
As r increases:
V => decreases as 1/r.
E => decreases faster as 1/r2.
Therefore, the graph showing the correct variation of V and E with r will have:
V showing a slower decay compared to E.
E decaying more sharply as r increases.

Free Tests

Free
Must Attempt

CDP Subject Test 01

languageIcon English
  • pdpQsnIcon20 Questions
  • pdpsheetsIcon20 Marks
  • timerIcon20 Mins
languageIcon English
Free
Must Attempt

EVS Subject Test 01

languageIcon English
  • pdpQsnIcon20 Questions
  • pdpsheetsIcon20 Marks
  • timerIcon20 Mins
languageIcon English
Free
Must Attempt

CTET Paper-I PYP (07 July 2024)

languageIcon English
  • pdpQsnIcon150 Questions
  • pdpsheetsIcon150 Marks
  • timerIcon150 Mins
languageIcon English
test-prime-package

Access ‘EMRS PGT’ Mock Tests with

  • 60000+ Mocks and Previous Year Papers
  • Unlimited Re-Attempts
  • Personalised Report Card
  • 500% Refund on Final Selection
  • Largest Community
students-icon
340k+ students have already unlocked exclusive benefits with Test Prime!
Our Plans
Monthsup-arrow