


Correct option is A
Solution:
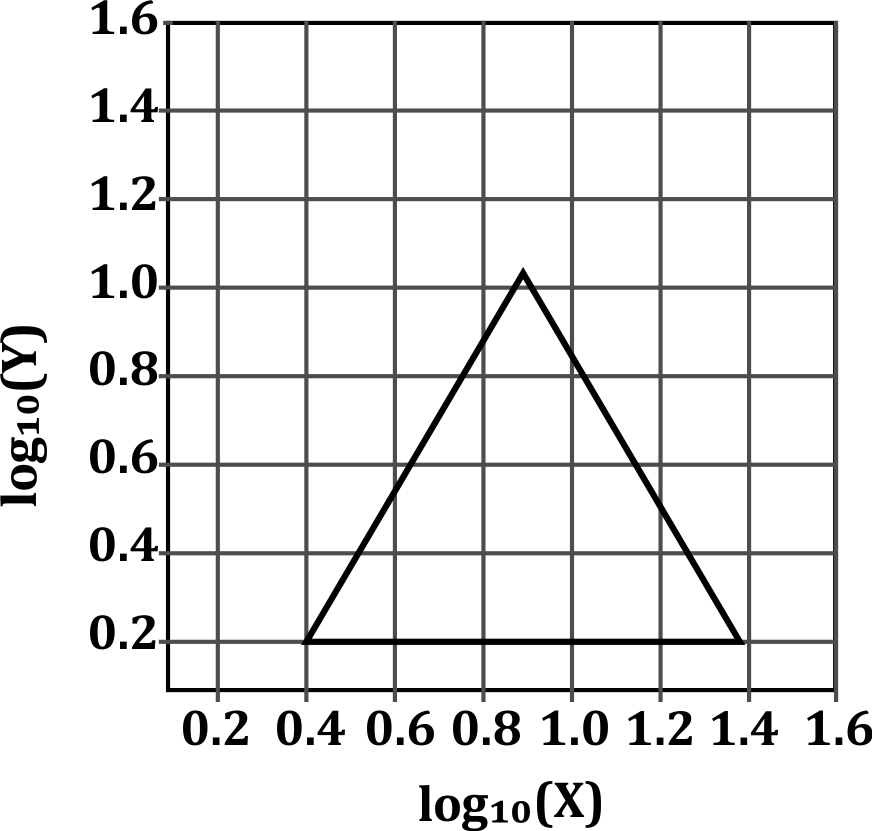
The triangle is shown on a log-log plot where:
- X-axis is log₁₀(X)
- Y-axis is log₁₀(Y)
This means the data in the triangle follows relationships of the form:
log(Y) = a × log(X) + b
which is equivalent to:
Y = k × Xa
So, straight lines in a log-log plot will appear as power-law curves in a linear scale.
What the triangle tells us:
In the log-log space:
- The triangle has one straight side rising, one straight side falling, and a flat base.
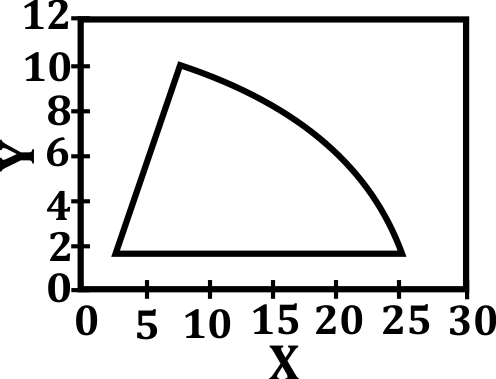
When this is transformed to a linear scale, the sides that are straight in log-log become curved, unless the slope is zero.
So, in linear scale:
- The rising side becomes a power function increasing curve
- The falling side becomes a power function decreasing curve
- The base becomes a nonlinear curve (except when log(Y) is constant, which is rare unless Y is constant)
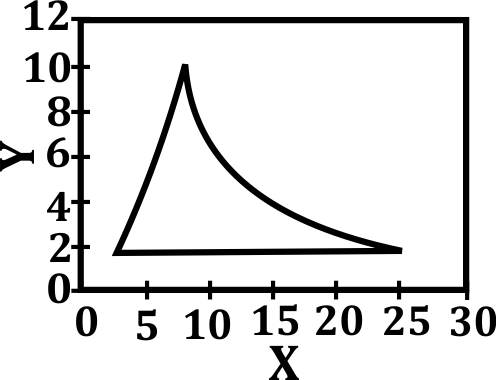
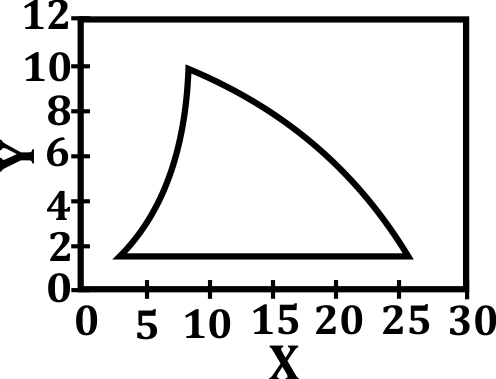
Why Option A is correct:
In Option A:
- The shape starts low, rises steeply, and then falls smoothly — matching the transformation of a triangle from log-log to linear scale.
- The curves follow expected power-law behavior:
- A steep rise on the left (X increases, Y increases quickly)
- A gradual fall on the right (Y decreases as X increases)
- A closed triangular-like region
Final Answer:
S. Ans. (A)
Option A is the correct linear-scale representation of the triangle in the log-log plot.
