All Courses
SSC CGL
SSC CHSL
SSC Maha Pack
SSC Stenographer
SSC MTS
SSC GD
Haryana Punjab High Court
DSSSB
SSC Selection Post
Delhi Police
SSC CPO
IB ACIO
UP Police
IB Security Assistant/MTS
Skill Development Courses
RRB NTPC
KVS Non Teaching
Railways Group D
EMRS Non Teaching
SSC Free Classes
DDA EXAMS
NVS Non Teaching
SSC Exams Books Kit
AFCAT
SSC Exams 2026-27
JKSSB
Intelligence Bureau
RPF
SSC Books
BSSC Inter Level
SSC Offline Exam
Allahabad HighCourt
MP Police
Coal India
SSC JHT
UPSSSC
UP Police Constable
CGL 5 Lakh Celebration
UPSSSC PET
Bihar Police Constable
BSF
CRPF
RRB JE
UP Home Guard
Kamyab Diwas 2026
Bihar Police SI Constable
Home
ITI
Electronic mechanic
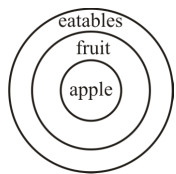
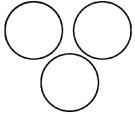
Which of the following Venn diagrams best represents the relationship between apples, fruits and eatables?
Question
Which of the following Venn diagrams best represents the relationship between apples, fruits and eatables?
A.
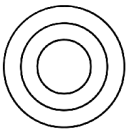
B.
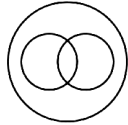
C.
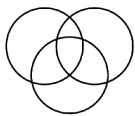
D.
Solution
Correct option is A
According to the question Venn diagram is as follows–
Option (a) is correct.
Similar Questions
1)
If current =1.414 A and resistance = 50Ω, then find power
2)
Forward biasing of a PN junction diode is indicated by which of the following connections?
3)
Which of the following is used as a receiver for fiber optical communication?
4)
Source of Light in optic fiber transmission is-
5)
Which of the following can be used to prevent race around condition in digital logic circuit?
6)
The current towards a junction is-
7)
78XX series ICs are?
8)
Which of the following gate have ' 0 ' output if one or more input is ' 0 '
9)
The average value of sine wave is times the peak value?
10)
UJT is not used for?
View More
Access ‘RRB ALP Electrician’ Mock Tests with
60000+ Mocks and Previous Year Papers
Unlimited Re-Attempts
Personalised Report Card
500% Refund on Final Selection
Largest Community
BUY NOW
446k+ students have already unlocked exclusive benefits with Test Prime!
Access ‘RRB ALP Electrician’ Mock Tests with
60000+ Mocks and Previous Year Papers
Unlimited Re-Attempts
Personalised Report Card
500% Refund on Final Selection
Largest Community
BUY NOW
446k+ students have already unlocked exclusive benefits with Test Prime!
Similar Questions
1)
If current =1.414 A and resistance = 50Ω, then find power
2)
Forward biasing of a PN junction diode is indicated by which of the following connections?
3)
Which of the following is used as a receiver for fiber optical communication?
4)
Source of Light in optic fiber transmission is-
5)
Which of the following can be used to prevent race around condition in digital logic circuit?
6)
The current towards a junction is-
7)
78XX series ICs are?
8)
Which of the following gate have ' 0 ' output if one or more input is ' 0 '
9)
The average value of sine wave is times the peak value?
10)
UJT is not used for?
View More
Our Plans
Months
BUY NOW