Correct option is C
Let's break down each of the statements:
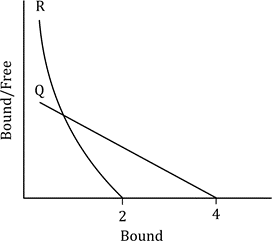
Inference A: Antibody Q is possibly a monoclonal while R is polyclonal
True: The Scatchard plot for monoclonal antibodies is typically linear, indicating a single type of binding interaction (one affinity). On the other hand, polyclonal antibodies often show a curved plot because they can bind to multiple epitopes with varying affinities. Based on this, the linear plot for Q suggests it may be monoclonal, while the curved plot for R suggests it could be polyclonal.
Inference C: The average affinity of R is more than the affinity of Q to the antigen
True: The affinity of an antibody is related to the slope of the Scatchard plot. A steeper slope in the Scatchard plot generally indicates higher affinity. Since polyclonal antibodies (like R) often bind to multiple epitopes and can have higher overall affinity, it is reasonable to assume that R may have a higher average affinity compared to the monoclonal antibody Q, which typically binds with a single affinity.
Inference D: Antibody Q is possibly IgA and R is IgG
True: While the Scatchard plot cannot directly tell us the immunoglobulin class (IgA, IgG, etc.) of the antibodies, we might infer from the plot patterns that IgA antibodies, which are often involved in mucosal immunity and have different functional properties, may behave differently than IgG antibodies. IgA might have a more complex pattern, potentially contributing to the polyclonal behavior seen in R. Hence, Q might be IgA (as a monoclonal) and R might be IgG (as polyclonal), though this is not conclusively determined from the Scatchard plot alone.
Inference B: The curved nature of Scatchard plot for R indicates that it cross-reacts with the blocking reagent
False: The curved plot for R suggests polyclonality, where the antibody binds to different epitopes with varying affinities. It does not necessarily imply cross-reactivity with the blocking reagent. The curve is more likely due to the diversity in binding sites on the polyclonal antibody, rather than non-specific binding or cross-reactivity with the blocking reagent.
Inference E: The valency of the antibodies cannot be inferred from the Scatchard plots
False: This statement is incorrect because the valency of antibodies can be inferred to some extent from the Scatchard plot. The number of binding sites (valency) can influence the shape of the plot, especially in polyclonal antibodies. In fact, polyclonal antibodies typically have a higher valency because they can bind to multiple epitopes. The valency of monoclonal antibodies (with a single epitope) can also be inferred from the plot shape and binding behavior
Correct Inferences Summary:
Inference A (monoclonal vs. polyclonal antibodies) is true.
Inference C (affinity comparison) is true.
Inference D (IgA and IgG) is possible but is a reasonable inference based on the patterns observed.
Inference B (cross-reactivity) is false.
Inference E (valency) is false.
Therefore, the correct answer is Option 3: A, C, D.
Information Booster
Monoclonal vs. Polyclonal: A monoclonal antibody typically produces a linear Scatchard plot, while a polyclonal antibody may produce a curved plot due to the variation in binding affinities for multiple epitopes.
Affinity: In Scatchard analysis, affinity is related to the slope of the plot. A higher slope typically indicates a higher affinity. Polyclonal antibodies, which can bind to multiple epitopes, might exhibit higher overall affinity than monoclonal antibodies, which bind to a single epitope.
IgA vs. IgG: While the immunoglobulin class cannot be definitively identified by a Scatchard plot, the different patterns in binding can sometimes hint at the class. IgA antibodies may show more complex or varied binding, while IgG is more commonly associated with polyclonal responses in immunology.