


Correct option is A
(a) Myoglobin: curve A, reaction i, equations III and IV. Hemoglobin: curve B, reaction ii, equations I and II.
Sol. Let's break down the given information:
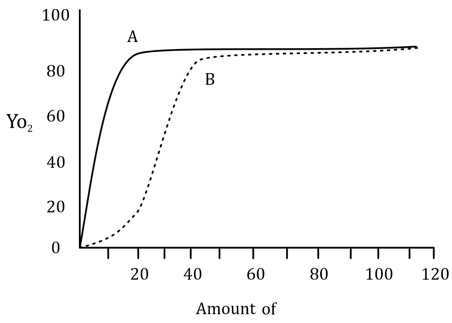
Curve A is characteristic of myoglobin. The graph shows a hyperbolic curve that is typical for myoglobin because it binds oxygen in a non-cooperative manner. As the oxygen concentration increases, myoglobin binds oxygen in a steady, almost linear fashion, indicating a hyperbolic binding curve.
Curve B represents hemoglobin, which shows a sigmoidal (S-shaped) curve, indicating cooperative binding. As the first molecule of oxygen binds to hemoglobin, the molecule undergoes a conformational change that makes it easier for subsequent oxygen molecules to bind. This cooperativity is reflected in the sigmoidal curve.
Myoglobin binds oxygen using the reaction i (E + S ↔ ES) and its equation is described by equation III, where the fraction of binding sites occupied by oxygen (Y_o) is given by the relationship where K is the dissociation constant and n is the Hill coefficient, which reflects the degree of cooperativity. Since myoglobin binds oxygen non-cooperatively, n = 1.
Hemoglobin binds oxygen cooperatively, described by reaction ii (E + nS ↔ ES_n), and the equation used to describe this cooperativity is equation I: where n is greater than 1 due to the cooperative binding of oxygen.
Thus, the correct combination is:
Myoglobin: curve A, reaction i, equations III and IV.
Hemoglobin: curve B, reaction ii, equations I and II.
Curve A (Myoglobin): Myoglobin is a monomeric protein that binds oxygen non-cooperatively, which results in a hyperbolic curve. This indicates that as oxygen binds, the affinity remains constant throughout the binding process. The Hill coefficient (n = 1) reflects this non-cooperative binding.
Curve B (Hemoglobin): Hemoglobin is a tetrameric protein that exhibits cooperative binding, which leads to a sigmoidal curve. The binding of the first oxygen molecule increases the affinity for the next molecules of oxygen, resulting in a steep rise in oxygen binding as the partial pressure of oxygen increases. The Hill coefficient (n > 1) reflects this positive cooperativity.
Reaction i and ii:
Reaction i: Describes the binding of a single molecule of oxygen to myoglobin, with a simple reversible reaction where oxygen binds to the myoglobin protein in a non-cooperative manner.
Reaction ii: Describes the cooperative binding of oxygen to hemoglobin, where binding of oxygen increases the affinity of hemoglobin for additional oxygen molecules.
- Additional Information:
Equations III and IV:
Equation III: This is used to describe myoglobin's binding of oxygen, which follows a simple hyperbolic model.
Equation IV: This could also describe the binding of oxygen in a non-cooperative manner, fitting with myoglobin’s behavior.
Equations I and II:
Equation I: Describes the cooperative binding of oxygen to hemoglobin, represented by a sigmoidal curve.
Equation II: Another way of describing the cooperative oxygen binding in hemoglobin, which takes into account the cooperative nature of oxygen binding to hemoglobin.
