Correct option is B
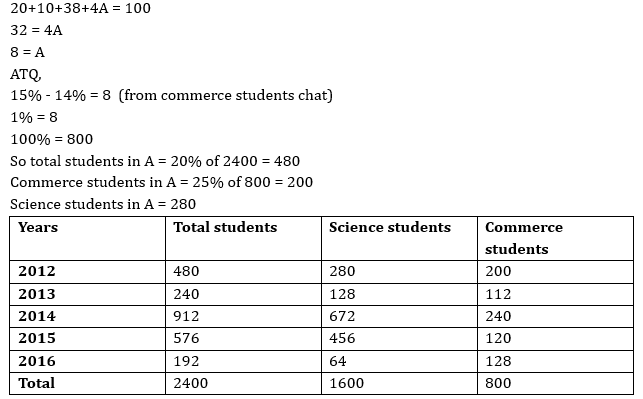


The pie chart given below shows the number of science and commerce student in five different year from 2012 to 2016 and another pie chart shows the percentage of commerce students.
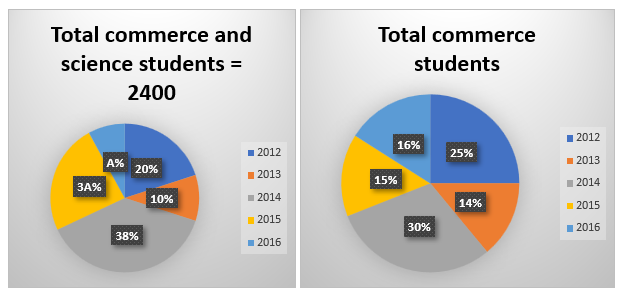
Note – (i) Total students = Commerce + Science.
(ii) Commerce students in 2013 is 8 less than that in 2015.
Find the ratio of commerce student in 2016 and 2015 to total student in 2015.
Required ratio = 120+128: 576 = 248:576 = 31: 72
Required answer = 456-(480+192)/2 =120
75% = 240
100% = 320
Total students in 2017 = 20% of 480 = 96
commerce students in 2017 = 75% of 120 = 90
Science students in 2017 = 96 – 90 = 6
 English
 100 Questions
 100 Marks
 60 Mins English English100 Questions100 Marks60 Mins English English35 Questions35 Marks20 Mins English
The pie chart given below shows the number of milk shops in 6 towns. The data is presented in the terms of percent.
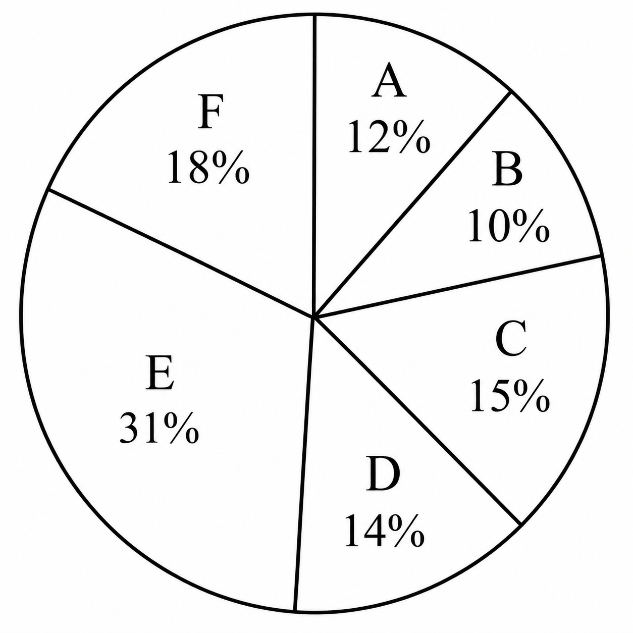
Central angle formed by sector of which town is 21.6 degrees more than the central angle formed by the sector of town A?
The pie chart given below shows the number of banks in 5 cities. The data is presented in the terms of percent. Difference between the total number of banks in N and Q and total number of banks in L and M = 2500.
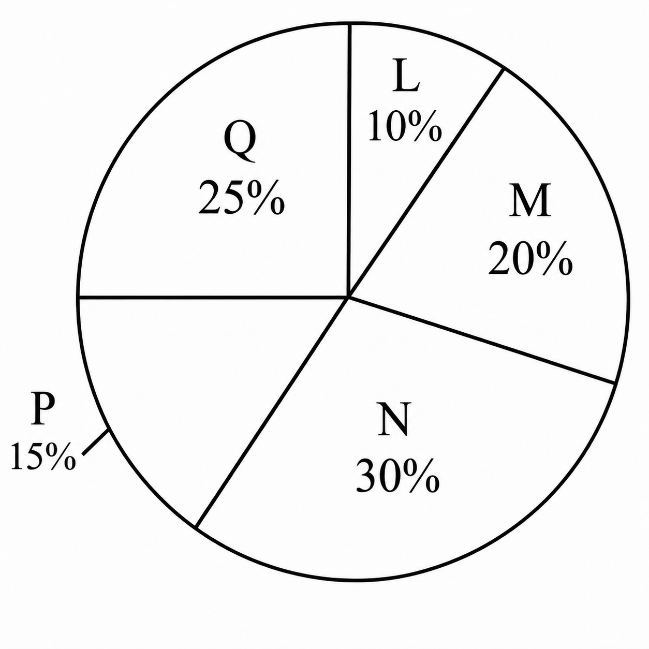
What is the ratio of number of banks in N to the total number of banks in P and Q?
The pie chart given below shows the runs scored by a batsman in 6 matches. The data is presented in the terms of degrees.
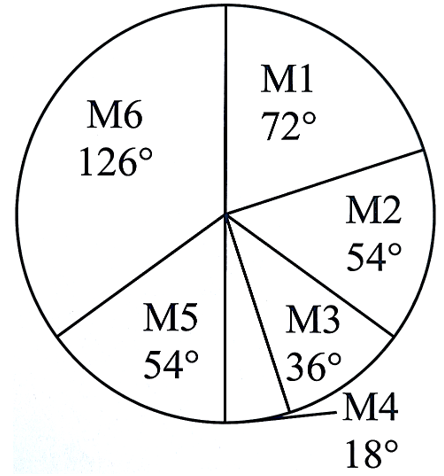
Total runs scored by the batsman in M6 and M5 are 240. What are the total runs scored by the batsman in M2 and M3?
The pie chart given below shows the number of books of 6 subjects in a bookstore.
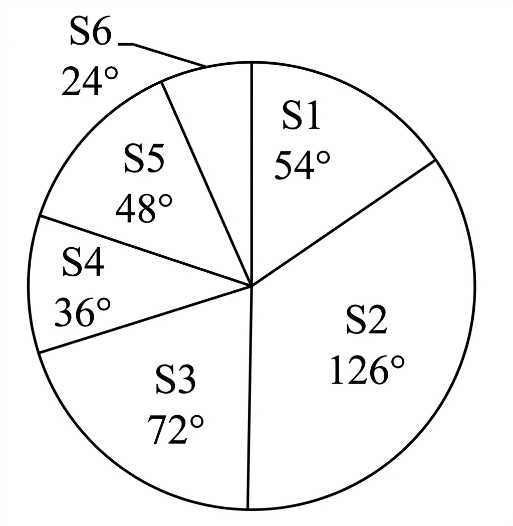
The data is presented in the terms of degrees. Number of books of S2 are 252. What are the total number of books of S1 and S5?
The pie chart given below shows the number of keys manufactured by 5 machines.
The data is presented in the terms of degrees. Average number of keys manufactured by M3 and M5 = 1500.
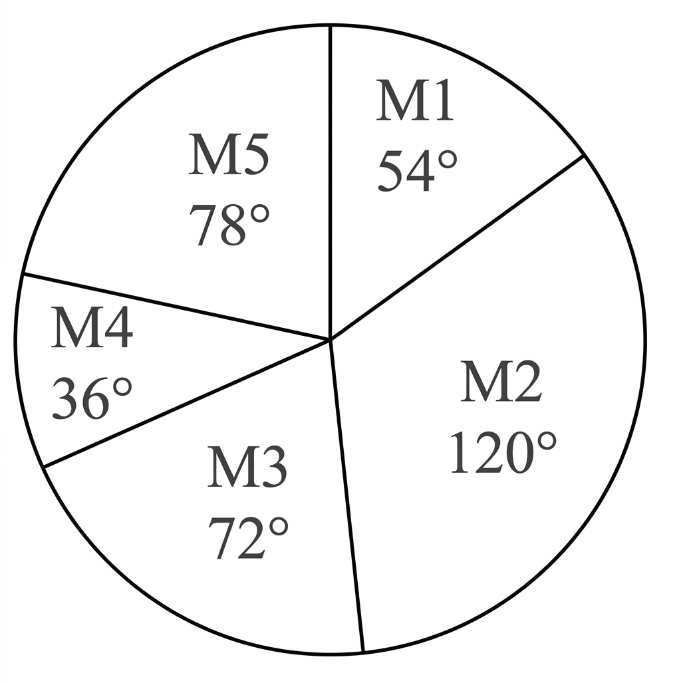
What are the total number of keys manufactured by the given 5 machines?
The pie chart given below shows the number of milk shops in 6 towns. The data is presented in the terms of percent.
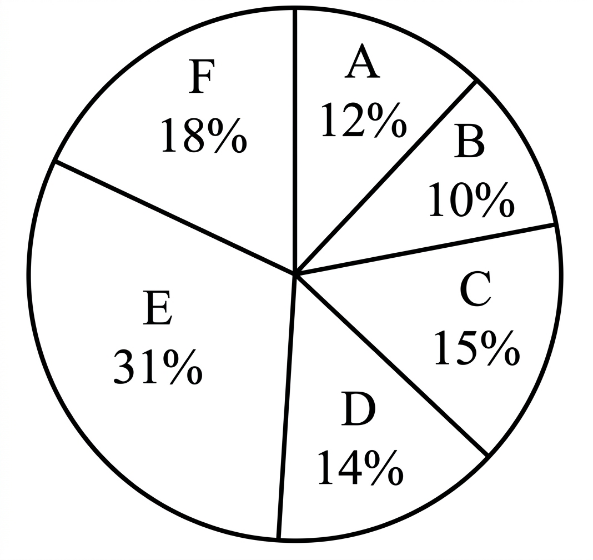
What is the total central angle (in degrees) formed by the sectors of B, C, D and F?
Pie-chart I shows the distribution of students who appeared in Board examination from schools A, B, C, D and E and pie-chart II shows the
distribution of students who passed the examination from these schools. Read both these pie-charts and answer the question :
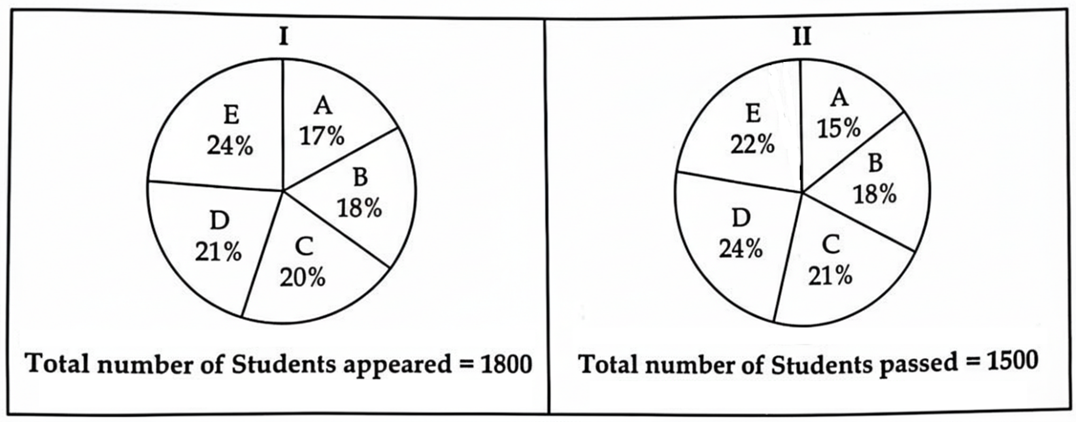
The total number of students who failed from schools B and D is what percent of the total number of students who passed from schools A and C?
Study the following pie chart carefully and answer the question that follows :
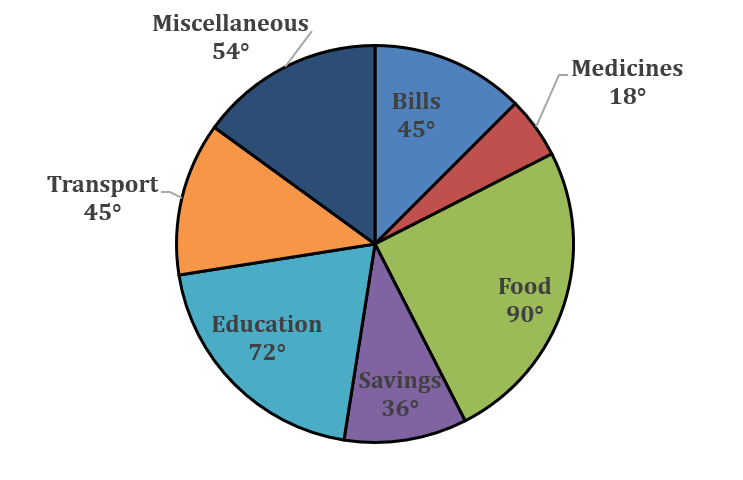
If the above pie chart shows the monthly expenditure of a family with monthly income ₹50,000, then find the ratio of the amount of 'Savings' to the amount spent on 'Food' :
Monthly budget of a family is shown in the pie chart. (The degree of Misc., Ent and Saving are same.)
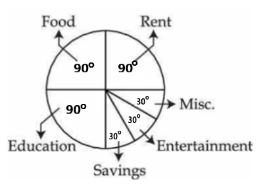
If savings of the family is ₹ 750, then monthly income is :
Monthly budget of a family is shown in the pie chart.
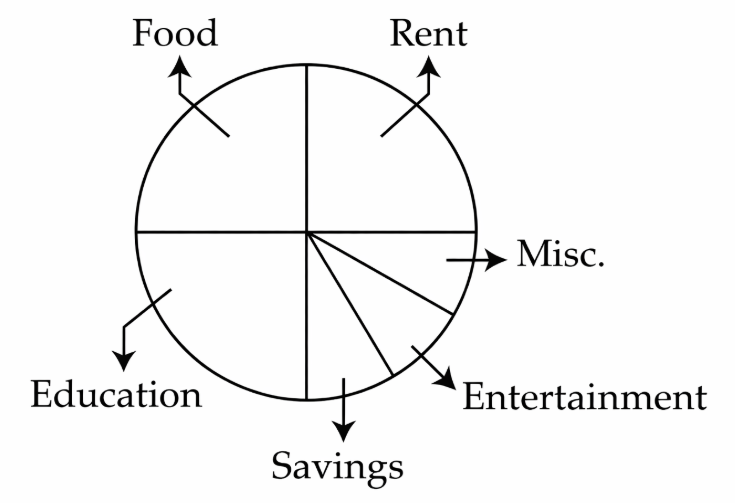
If savings of family is 750, then monthly income is :

Suggested Test Series

Suggested Test Series