arrow
arrow
arrow
The pie chart given below shows the expenditure of a certain company across various sectors -P, Q, R, S, T and U - during a particular year. Study the
Question

The pie chart given below shows the expenditure of a certain company across various sectors -P, Q, R, S, T and U - during a particular year. Study the graph and answer the question.

What approximate percentage of the total spending is spent on sector S?

A.

28.3%

B.

24%

C.

20.05%

D.

26.4%

Correct option is D

Given:

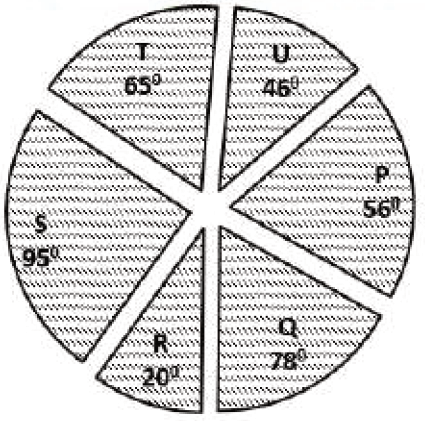
Angle for sector S = 95°

Total angle of the pie chart = 360°

Formula used:

Percentage of spending on sector S = Angle ofsectorSTotal angle of the pie chart×100\frac{Angle\ of sector S}{Total\ angle \ of \ the\ pie\ chart} \times 100

Solution:

Percentage of spending on sector S = 95360×100\frac{95}{360}\times100

= 26.4%

​26.4% of the total spending is spent on sector S.

Thus, correct option is (d)

Free Tests

Free
Must Attempt

CBT-1 Full Mock Test 1

languageIcon English
  • pdpQsnIcon100 Questions
  • pdpsheetsIcon100 Marks
  • timerIcon90 Mins
languageIcon English
Free
Must Attempt

RRB NTPC Graduate Level PYP (Held on 5 Jun 2025 S1)

languageIcon English
  • pdpQsnIcon100 Questions
  • pdpsheetsIcon100 Marks
  • timerIcon90 Mins
languageIcon English
Free
Must Attempt

CBT-1 General Awareness Section Test 1

languageIcon English
  • pdpQsnIcon40 Questions
  • pdpsheetsIcon30 Marks
  • timerIcon25 Mins
languageIcon English

Similar Questions

test-prime-package

Access ‘RRB Group D’ Mock Tests with

  • 60000+ Mocks and Previous Year Papers
  • Unlimited Re-Attempts
  • Personalised Report Card
  • 500% Refund on Final Selection
  • Largest Community
students-icon
354k+ students have already unlocked exclusive benefits with Test Prime!
Our Plans
Monthsup-arrow