Correct option is C
Solution :
Regression Equation:
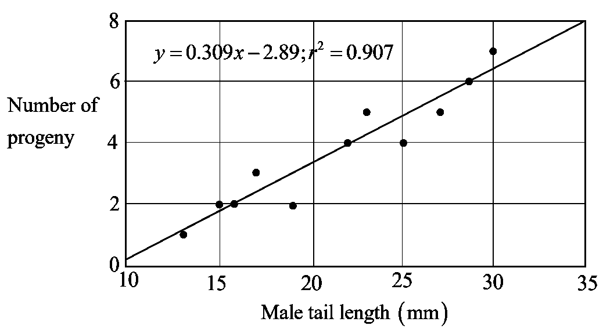
The equation of the regression line is:
y=0.309x−2.89
where:
y = is the number of progeny.
x = is the male tail length (mm)
Interpretation of the Slope:
The slope
0.309 is positive, meaning that as the tail length increases, the number of progeny also increases.
Inference from the graph:
Positive Correlation:
The regression line y=0.309x−2.89y = 0.309x - 2.89y=0.309x−2.89 indicates a positive correlation between male tail length (in mm) and the number of progeny. As the male tail length increases, the number of progeny also tends to increase.Strength of Relationship:
The coefficient of determination (r2=0.907r^2 = 0.907r2= 0.907) shows that 90.7% of the variation in the number of progeny is explained by the male tail length. This suggests a very strong linear relationship.Regression Slope:
The slope 0.3090.3090.309 indicates that for each additional millimeter increase in the tail length, the number of progeny increases by approximately 0.309 units.
Final Answer : Option (C) Males with longer tails tend to father more progeny.