Correct option is B
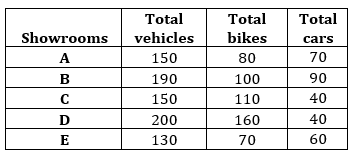


The graph given below shows the total number of vehicles (cars + bikes) and total number of bikes in five different showrooms. Read the graph and answer the following question.
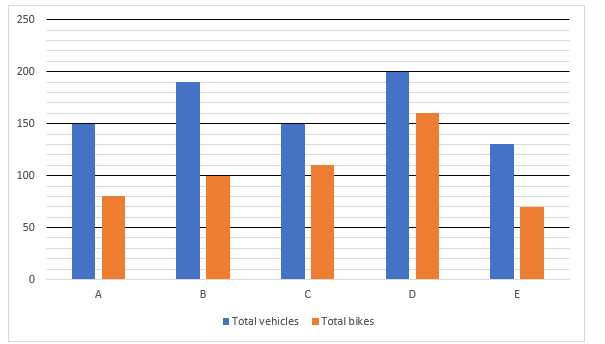
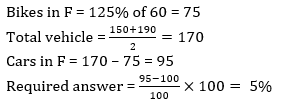
In shop F, total number of bikes are 25% more than the cars in E and total number of vehicles are average number of vehicles in A and B. Find the cars in F is what percentage more/less than bikes in B.

The ratio of sold to unsold bikes in D is 3:1 and number of unsold bikes in D is 20% less than cars sold by B. Find the unsold cars in B.
Online booked cars = 60
Car booked offline = 70 – 60 = 10
Bike booked online = 20% of 80 = 16
Bike booked offline = 80 – 16 = 64
Required answer = (60 + 16)- (10 + 64) = 76 – 74 = 2
Defective cars in D = 1/8 of 80 = 10
Non defective cars in D = 40 – 10 = 30
Non – defective bike in D = ½ of 30 = 15
Defective bike in D = 160 – 15 = 145
Required answer = 145 + 10 = 155
 English
 100 Questions
 100 Marks
 60 Mins English English35 Questions35 Marks20 Mins English English35 Questions35 Marks20 Mins English
The bar graph given below shows the number of mobile phones sold by the given 5 brands in a month.
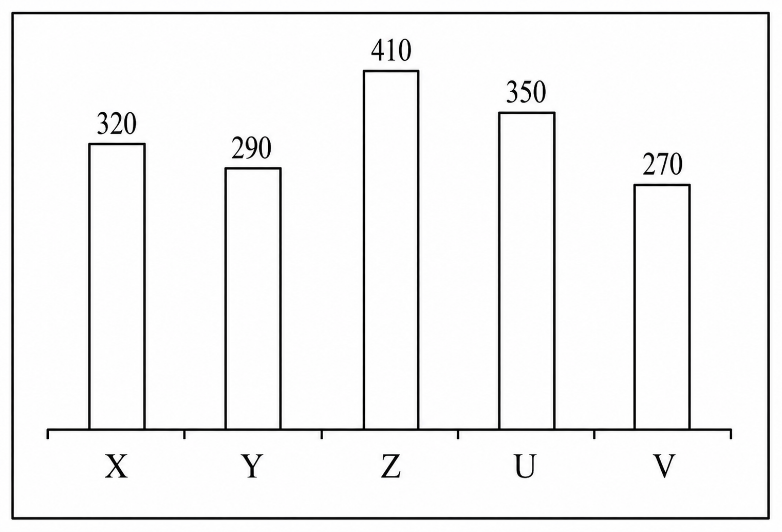
A = Total number of mobile phones sold by brand X and Y.
B = Total number of mobile phones sold by brand Z and U.
What is the value of A : B?
The bar graph given below shows the number of male voters (P) and female voters (Q) in 5 states.
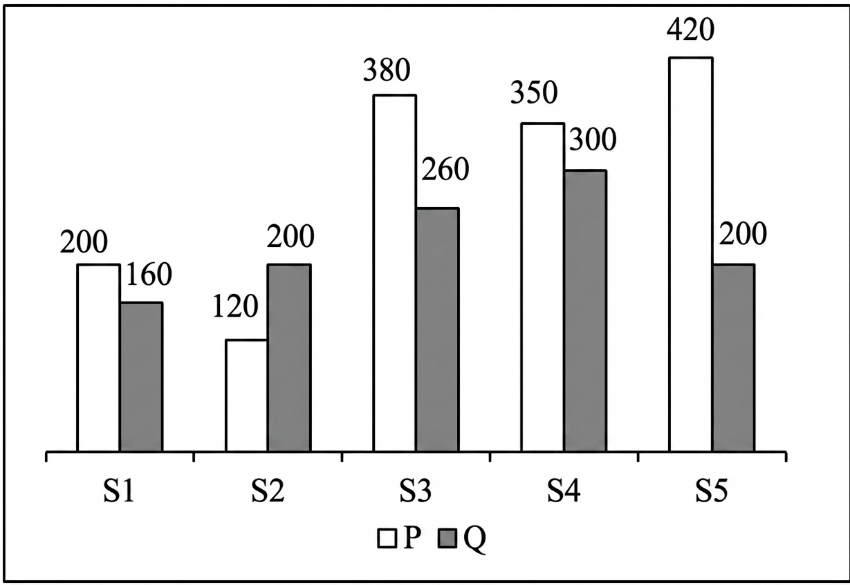
Which of the following statement is correct?
I. In state S2, female voters are 80 more than male voters.
II. In state S4, male voters are 50 more than female voters.
The bar graph given below shows the income of a person on the given 6 days.
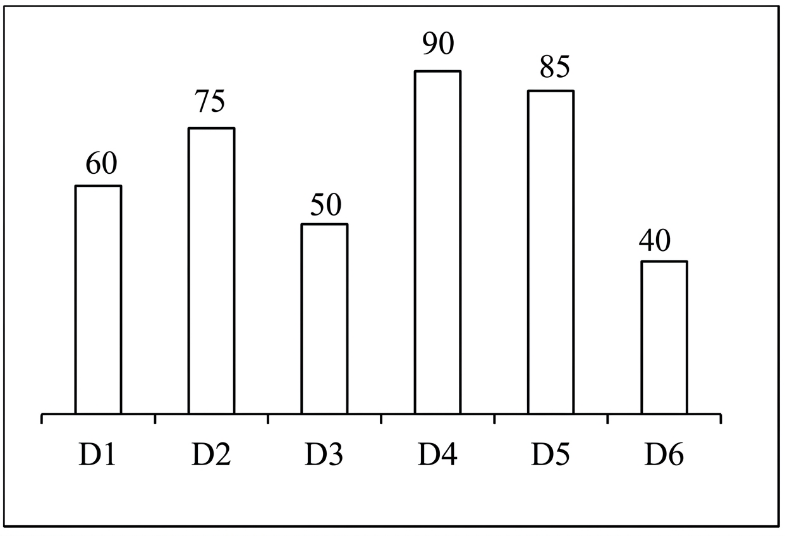
What is the average income of the person on the given 6 days?
The bar graph given below shows the number of cars produced in the given 5 years.
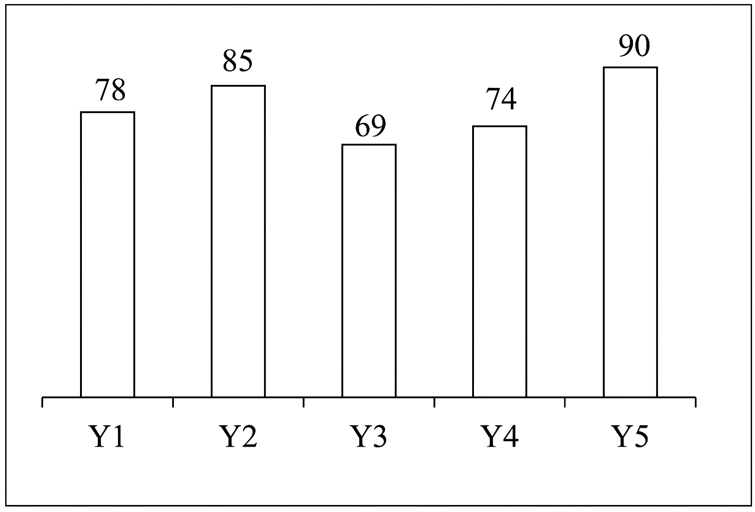
Number of cars produced in Y4 are what percent more than number of cars produced in Y3?
The bar graph given below shows the number of cars produced in the given 5 years.
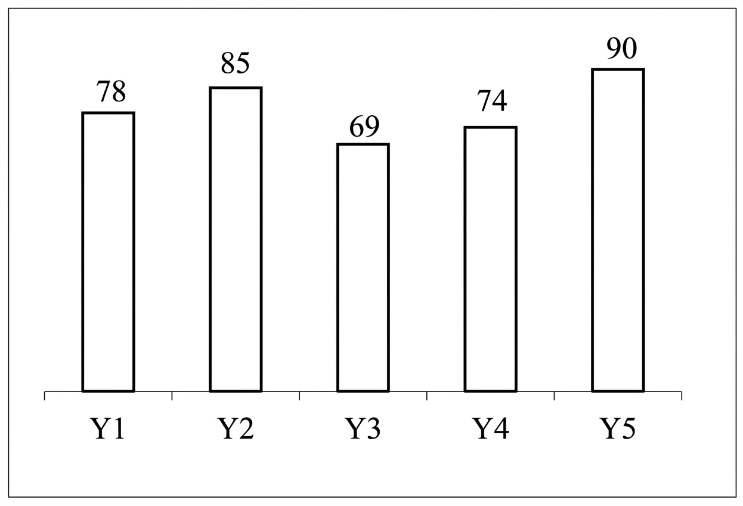
R = Average number of cars produced in the given 5 years
A = Total number of cars produced in Y2, Y3 and Y4.
What is the value of A - R?
The bar graph given below shows the number of T1 bank and T2 bank in the given 4 states.
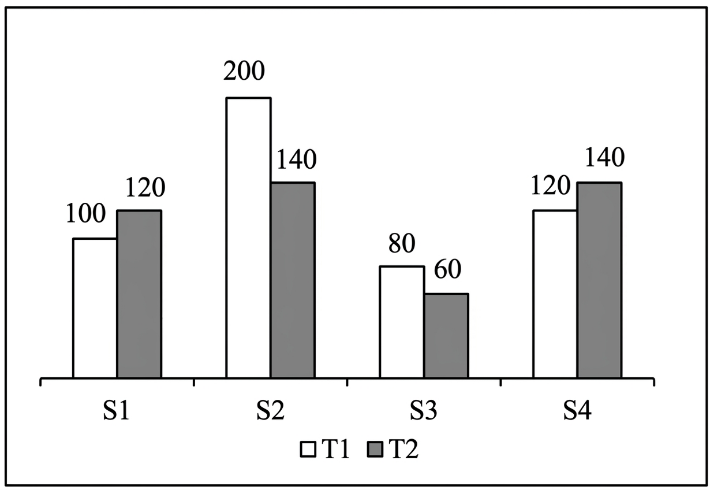
What is respective ratio of number of T1 bank and number of T2 bank in state S2?
Study the following histogram and answer the question :

(Note: The number of lamps is a multiple of 5)
The difference between the total number of neon lamps whose life time is 400 hours or more but less than 700 hours and the total number of neon lamps whose life time is 900 hours or more is t. The value of t lies between :
Study the following graph and answer the question given below.Imports and exports of a country during 2020 to 2024

By what percent is the total imports of the country during 2022 and 2023 less than the total exports during2020, 2021 and 2024?
Study the given graph carefully and answer the given question.
The graph shows the number of students appeared and passed in class XI final exams in a school in different years.

In which year the pass percentage is the highest?
[pass percentage =(No. of students passed/Number of students appeared in exam)× 100]
Study the following graph to answer the question.

India’s exports to which of the following regions increased most in terms of percentage between 2000-01 and 2010 – 2011?

Suggested Test Series

Suggested Test Series
The bar graph given below shows the number of mobile phones sold by the given 5 brands in a month.
A = Total number of mobile phones sold by brand X and Y.
B = Total number of mobile phones sold by brand Z and U.
What is the value of A : B?
The bar graph given below shows the number of male voters (P) and female voters (Q) in 5 states.
Which of the following statement is correct?
I. In state S2, female voters are 80 more than male voters.
II. In state S4, male voters are 50 more than female voters.
The bar graph given below shows the income of a person on the given 6 days.
What is the average income of the person on the given 6 days?
The bar graph given below shows the number of cars produced in the given 5 years.
Number of cars produced in Y4 are what percent more than number of cars produced in Y3?
The bar graph given below shows the number of cars produced in the given 5 years.
R = Average number of cars produced in the given 5 years
A = Total number of cars produced in Y2, Y3 and Y4.
What is the value of A - R?
The bar graph given below shows the number of T1 bank and T2 bank in the given 4 states.
What is respective ratio of number of T1 bank and number of T2 bank in state S2?
Study the following histogram and answer the question :
(Note: The number of lamps is a multiple of 5)
The difference between the total number of neon lamps whose life time is 400 hours or more but less than 700 hours and the total number of neon lamps whose life time is 900 hours or more is t. The value of t lies between :
Study the following graph and answer the question given below.Imports and exports of a country during 2020 to 2024
By what percent is the total imports of the country during 2022 and 2023 less than the total exports during2020, 2021 and 2024?
Study the given graph carefully and answer the given question.
The graph shows the number of students appeared and passed in class XI final exams in a school in different years.
In which year the pass percentage is the highest?
[pass percentage =(No. of students passed/Number of students appeared in exam)× 100]
Study the following graph to answer the question.
India’s exports to which of the following regions increased most in terms of percentage between 2000-01 and 2010 – 2011?