arrow
arrow
arrow
The given pie diagram shows how a student spent his pocket money amounting to ₹3,500 during the course of a month.How much more money (in ₹) did he sp
Question

The given pie diagram shows how a student spent his pocket money amounting to ₹3,500 during the course of a month.

How much more money (in ₹) did he spend on food as compared with what he spent on entertainment?  

A.

875

B.

700

C.

1,050

D.

525

Correct option is C

Given:
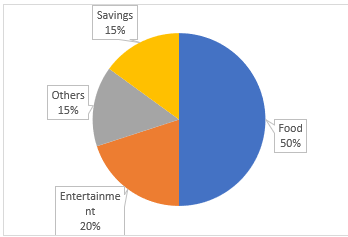
Total pocket money: ₹3,500
Percentage of amount spent on food = 50%
Percentage of amount spent on entertainment = 20% 
Formula Used:
Amount spent in a category=(Percentage100)×Total money\text{Amount spent in a category} = \left(\frac{\text{Percentage}}{100}\right) \times \text{Total money}   
Solution:   
As we know, the expenditure percentage on food is higher than entertainment.
difference between percentage of food and entertainment = 50 - 20 = 30%   
Now,  30100×3500=1050\frac{30}{100}\times 3500 = ₹1050    
Thus, Student spent ₹1050 more on the food as compared to entertainment. 


Free Tests

Free
Must Attempt

CBT-1 Full Mock Test 1

languageIcon English
  • pdpQsnIcon100 Questions
  • pdpsheetsIcon100 Marks
  • timerIcon90 Mins
languageIcon English
Free
Must Attempt

RRB NTPC Graduate Level PYP (Held on 5 Jun 2025 S1)

languageIcon English
  • pdpQsnIcon100 Questions
  • pdpsheetsIcon100 Marks
  • timerIcon90 Mins
languageIcon English
Free
Must Attempt

CBT-1 General Awareness Section Test 1

languageIcon English
  • pdpQsnIcon40 Questions
  • pdpsheetsIcon30 Marks
  • timerIcon25 Mins
languageIcon English

Similar Questions

test-prime-package

Access ‘RRB NTPC’ Mock Tests with

  • 60000+ Mocks and Previous Year Papers
  • Unlimited Re-Attempts
  • Personalised Report Card
  • 500% Refund on Final Selection
  • Largest Community
students-icon
353k+ students have already unlocked exclusive benefits with Test Prime!
Our Plans
Monthsup-arrow