arrow
arrow
arrow
The given diagram depicts the distribution of salaries per annum (in lakh) of the CEOs of six MNCs (C1, C2, C3, C4, C5 and C6).What is the difference
Question

The given diagram depicts the distribution of salaries per annum (in lakh) of the CEOs of six MNCs (C1, C2, C3, C4, C5 and C6).

What is the difference of the salary drawn (in percentage) between the lowest and highest paid CEO?

A.

20

B.

50

C.

75

D.

25

Correct option is B

Given:

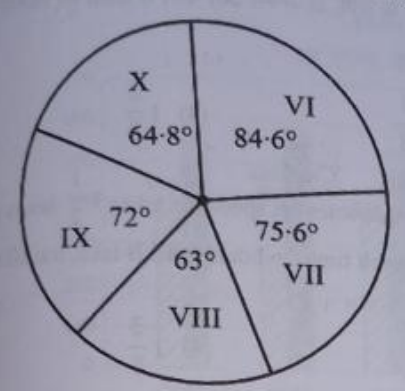
Diagram depicts the distribution of salaries per annum (in lakh) of the CEOs of six MNCs (C1, C2, C3, C4, C5 and C6).

Formula used:

Percentage Difference = Highest SalaryLowest SalaryLowest Salary×100\frac{Highest \ Salary - Lowest \ Salary}{Lowest \ Salary} \times 100​​

Solution:

Data from the chart:

Highest salary = 75 Lakhs

Lowest salary = 50 Lakhs

Percentage Difference = 755050×100\frac{75 - 50}{50} \times 100 = 2550×100\frac{25}{50} \times 100 = 50%

​The difference in salary drawn between the lowest and highest paid CEO is 50%.​

​​

Free Tests

Free
Must Attempt

CBT-1 Full Mock Test 1

languageIcon English
  • pdpQsnIcon100 Questions
  • pdpsheetsIcon100 Marks
  • timerIcon90 Mins
languageIcon English
Free
Must Attempt

RRB NTPC Graduate Level PYP (Held on 5 Jun 2025 S1)

languageIcon English
  • pdpQsnIcon100 Questions
  • pdpsheetsIcon100 Marks
  • timerIcon90 Mins
languageIcon English
Free
Must Attempt

CBT-1 General Awareness Section Test 1

languageIcon English
  • pdpQsnIcon40 Questions
  • pdpsheetsIcon30 Marks
  • timerIcon25 Mins
languageIcon English

Similar Questions

test-prime-package

Access ‘RRB NTPC’ Mock Tests with

  • 60000+ Mocks and Previous Year Papers
  • Unlimited Re-Attempts
  • Personalised Report Card
  • 500% Refund on Final Selection
  • Largest Community
students-icon
354k+ students have already unlocked exclusive benefits with Test Prime!
Our Plans
Monthsup-arrow