arrow
arrow
arrow
The given bar graph shows the total number of wireless keyboards (in thousands) produced by five different branches of a company , B1 , B2 , B3 , B4 a
Question

The given bar graph shows the total number of wireless keyboards (in thousands) produced by five different branches of a company , B1 , B2 , B3 , B4 and B5 in 2015 and 2016. Study the graph and answer the following question.

The number of wireless keyboards produced by branch B4 in 2016 is equal to that produced by which branch in 2015?

A.

B1 and B3

B.

only B2

C.

B3 and B5

D.

Only B1

Correct option is D

The above information can be represented as 
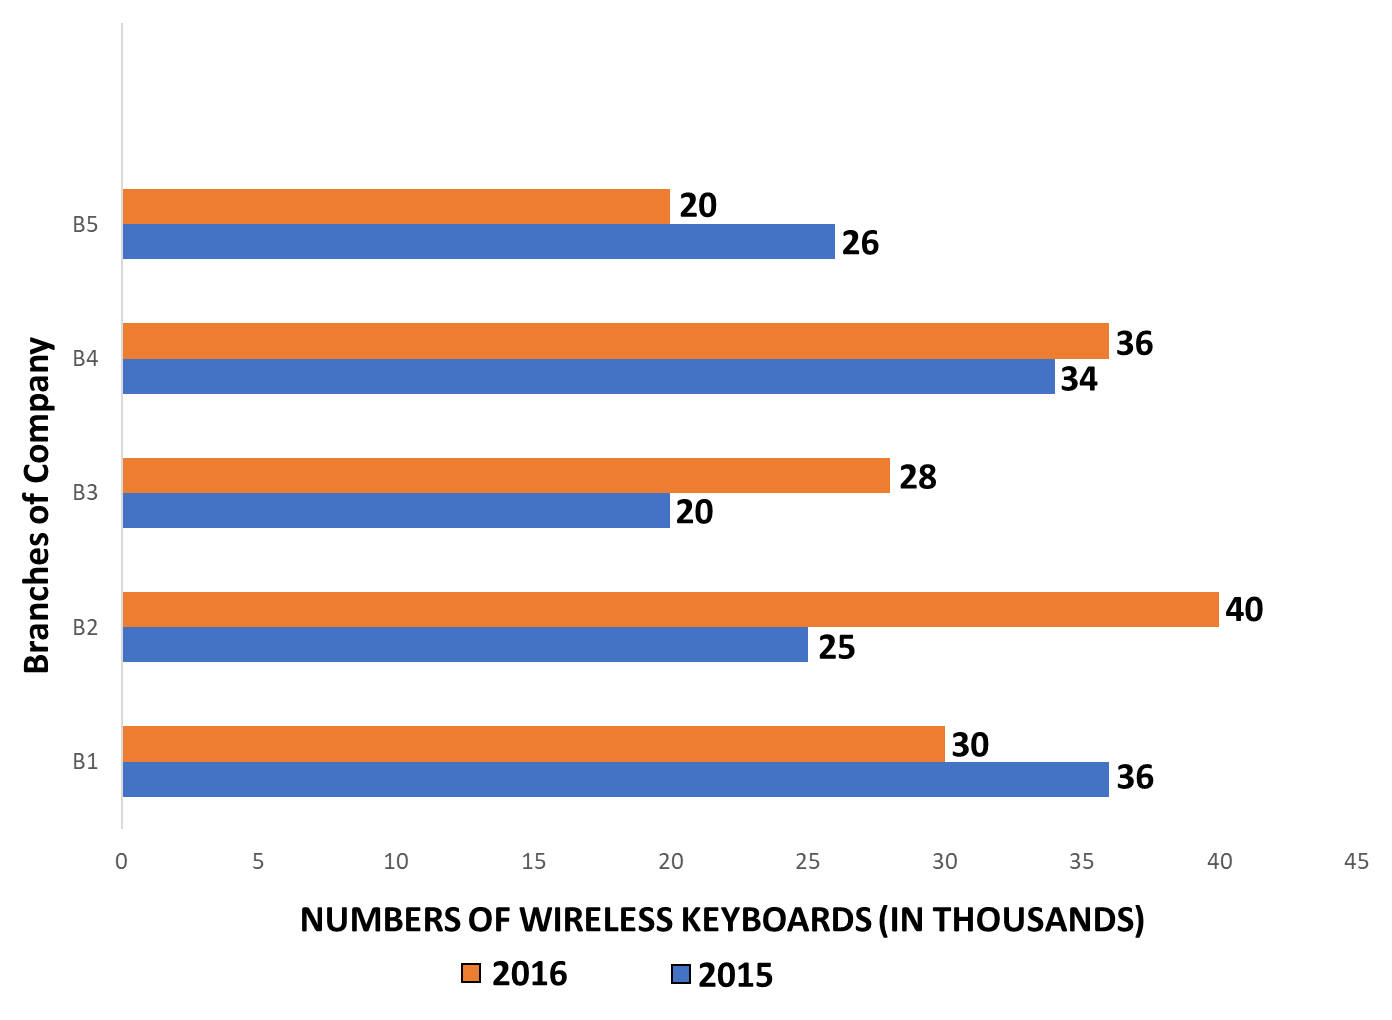
Branch/Year
2015
2016
B5
26
20
B4
34
36
B3
20
28
B2
25
40
B1
36
30

from the above table we can say that:
Number of wireless keyboards of branch B1 in  (2015) = Number of wireless keyboards of branch B4 in (2016)

Hence, option (d) is the correct answer.

Free Tests

Free
Must Attempt

CBT-1 Full Mock Test 1

languageIcon English
  • pdpQsnIcon100 Questions
  • pdpsheetsIcon100 Marks
  • timerIcon90 Mins
languageIcon English
Free
Must Attempt

RRB NTPC Graduate Level PYP (Held on 5 Jun 2025 S1)

languageIcon English
  • pdpQsnIcon100 Questions
  • pdpsheetsIcon100 Marks
  • timerIcon90 Mins
languageIcon English
Free
Must Attempt

CBT-1 General Awareness Section Test 1

languageIcon English
  • pdpQsnIcon40 Questions
  • pdpsheetsIcon30 Marks
  • timerIcon25 Mins
languageIcon English

Similar Questions

test-prime-package

Access ‘RRB NTPC’ Mock Tests with

  • 60000+ Mocks and Previous Year Papers
  • Unlimited Re-Attempts
  • Personalised Report Card
  • 500% Refund on Final Selection
  • Largest Community
students-icon
354k+ students have already unlocked exclusive benefits with Test Prime!
Our Plans
Monthsup-arrow