arrow
arrow
arrow
The given bar graph shows the sales of inverters of five different shops A,B,C,D and E in the years 2017 and 2018.What is the ratio of the total sales
Question

The given bar graph shows the sales of inverters of five different shops A,B,C,D and E in the years 2017 and 2018.

What is the ratio of the total sales of shop A for both the years to that of Shop D for both the years?

A.

5 : 3

B.

6 : 5

C.

1 : 3

D.

7 : 6

Correct option is D

Calculation

ATQ,

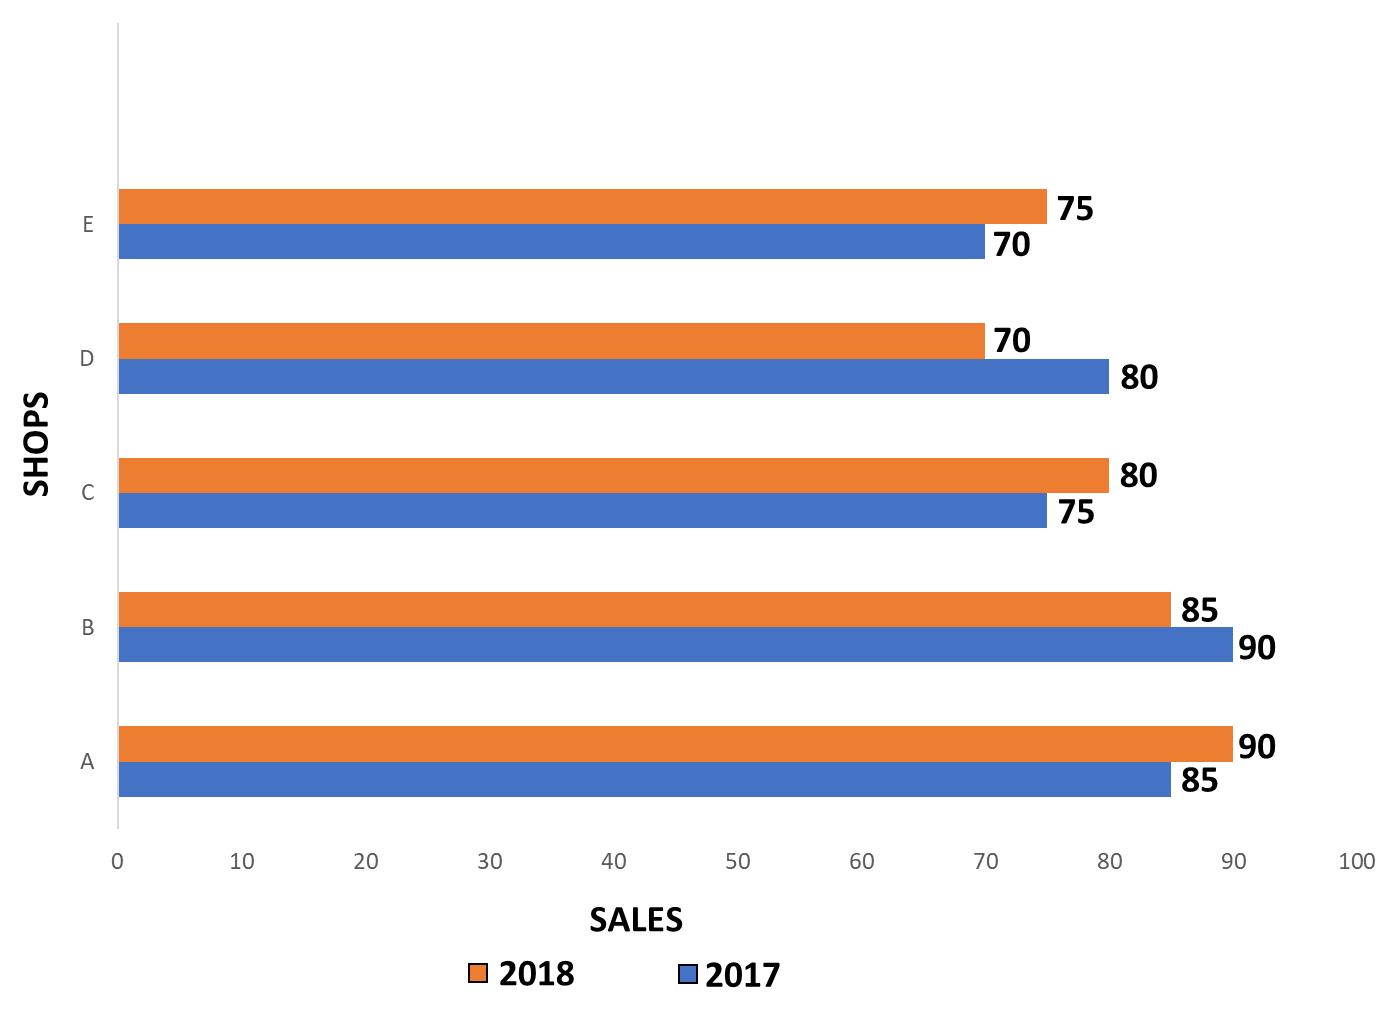
Sales of A for both the years = 85 + 90 = 175

Sales of D for both the years = 70 + 80 = 150

The ratio of the total sales of shop A for both years to that of shop D for both years =  175150=76=7:6\frac{175}{150}=\frac{7}{6}= 7 : 6​​

Hence,  The ratio of the total sales of shop A for both the years to that of shop D for both years is 7 : 6.

Therefore, option (d) is the correct answer.


Free Tests

Free
Must Attempt

CBT-1 Full Mock Test 1

languageIcon English
  • pdpQsnIcon100 Questions
  • pdpsheetsIcon100 Marks
  • timerIcon90 Mins
languageIcon English
Free
Must Attempt

RRB NTPC Graduate Level PYP (Held on 5 Jun 2025 S1)

languageIcon English
  • pdpQsnIcon100 Questions
  • pdpsheetsIcon100 Marks
  • timerIcon90 Mins
languageIcon English
Free
Must Attempt

CBT-1 General Awareness Section Test 1

languageIcon English
  • pdpQsnIcon40 Questions
  • pdpsheetsIcon30 Marks
  • timerIcon25 Mins
languageIcon English

Similar Questions

test-prime-package

Access ‘RRB NTPC’ Mock Tests with

  • 60000+ Mocks and Previous Year Papers
  • Unlimited Re-Attempts
  • Personalised Report Card
  • 500% Refund on Final Selection
  • Largest Community
students-icon
353k+ students have already unlocked exclusive benefits with Test Prime!
Our Plans
Monthsup-arrow