hamburger menu
All Coursesall course arrow
adda247
reward-icon
adda247
    arrow
    arrow
    arrow
    The given bar graph shows the number of students enrolled in Institutes A and B during 5 years (2018 to 2022). What is the ratio of the t
    Question

    The given bar graph shows the number of students enrolled in Institutes A and B during 5 years (2018 to 2022).

    What is the ratio of the total students enrolled in Institute B in 2019, 2020 and 2022 to that of the total students enrolled in Institute A in 2018, 2020 and 2021?

    A.

    37 : 28

    B.

    11 : 28

    C.

    28 : 11

    D.

    28 : 37

    Correct option is A

    Solution:

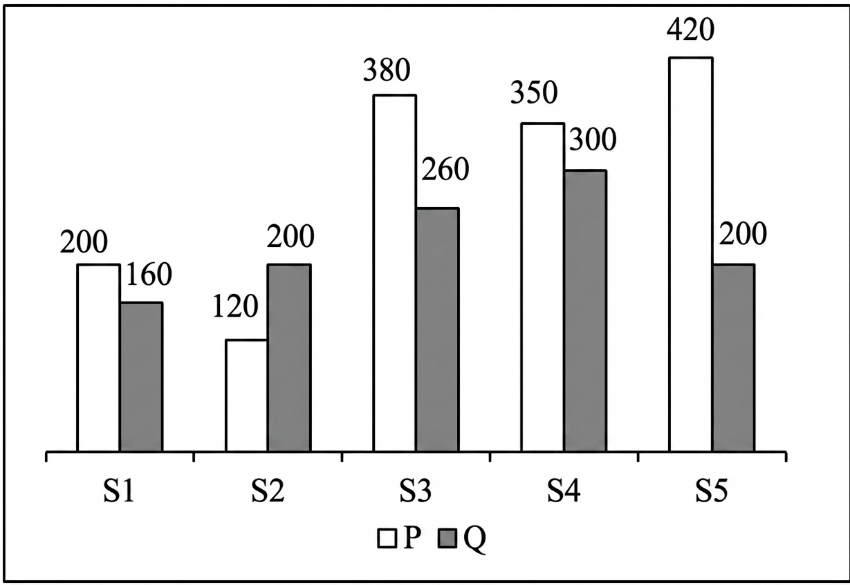
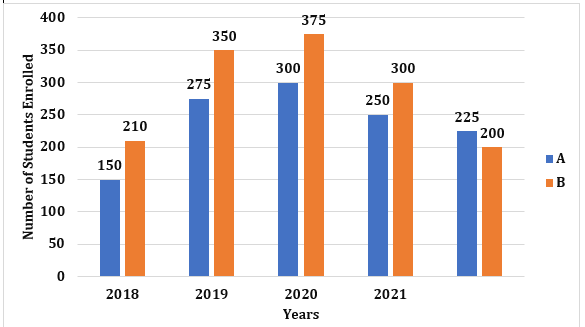
    Total students enrolled in Institute B in 2019, 2020, and 2022 = 350 + 375 + 200

    Total students enrolled in Institute B in 2019, 2020, and 2022 = 925

    Total students enrolled in Institute A in 2018, 2020, and 2021 = 150 + 300 + 250

    Total students enrolled in Institute A in 2018, 2020, and 2021 = 700

    Ratio = 925700=3728=37:28\frac{925}{700}=\frac{37}{28}=37:28​​

    Free Tests

    Free
    Must Attempt

    SSC GD PYP (Held on 4 Feb 2025 S1)

    languageIcon English
    • pdpQsnIcon80 Questions
    • pdpsheetsIcon160 Marks
    • timerIcon60 Mins
    languageIcon English
    Free
    Must Attempt

    Hindi Section Test 1

    languageIcon English
    • pdpQsnIcon20 Questions
    • pdpsheetsIcon40 Marks
    • timerIcon12 Mins
    languageIcon English
    Free
    Must Attempt

    SSC GD Constable Full Mock Test 1

    languageIcon English
    • pdpQsnIcon80 Questions
    • pdpsheetsIcon160 Marks
    • timerIcon60 Mins
    languageIcon English

    Similar Questions

    test-prime-package

    Access ‘SSC CGL Tier I’ Mock Tests with

    • 60000+ Mocks and Previous Year Papers
    • Unlimited Re-Attempts
    • Personalised Report Card
    • 500% Refund on Final Selection
    • Largest Community
    students-icon
    354k+ students have already unlocked exclusive benefits with Test Prime!
    Our Plans
    Monthsup-arrow