Correct option is C
Given:
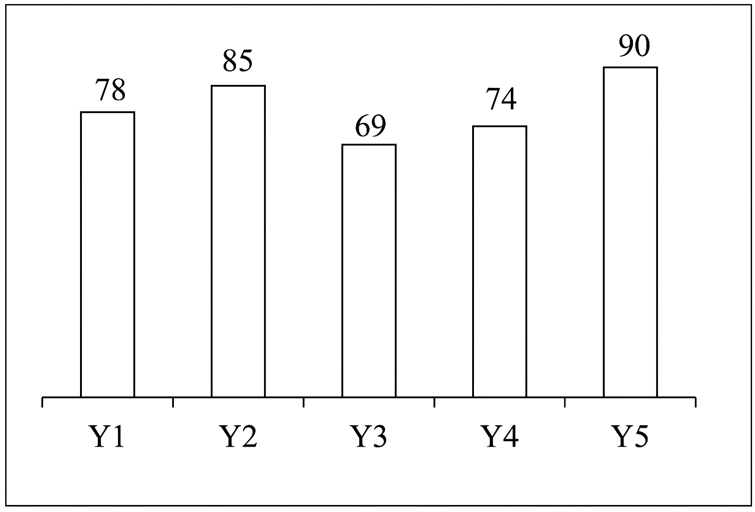
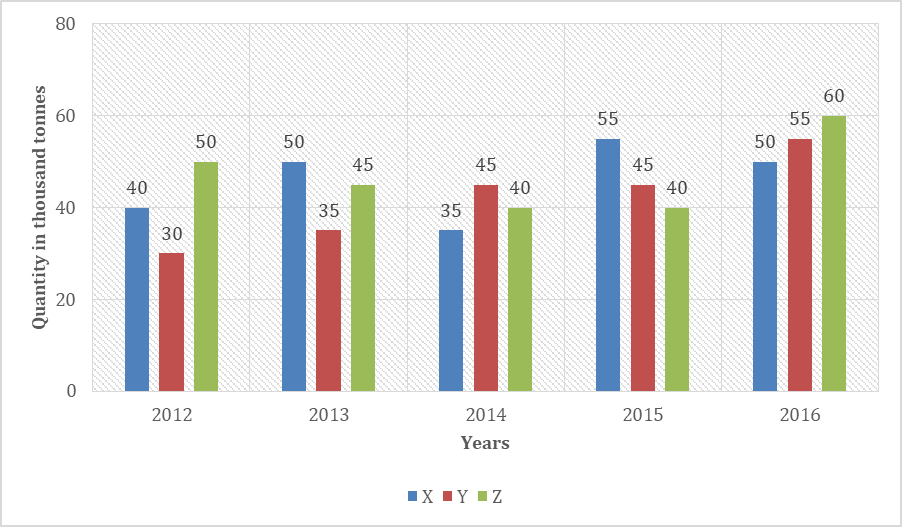
The bar graph shows the production (in thousand tonnes) of milk chocolates by three companies (X, Y, and Z) from 2012 to 2016.
The quantities for Company Y are as follows:
2012: 30
2013: 35
2014: 45
2015: 45
2016: 55
Formula Used:
Percentage Change = Old ValueNew Value−Old Value×100
Solution:
For 2013, compared to 2012:
3035−30×100=305×100=16.67%
For 2014, compared to 2013:
3545−35×100=3510×100=28.57%
For 2015, compared to 2014:
4545−45×100=450×100=0% (fall)
For 2016, compared to 2015:
4555−45×100=4010×100=25%
The maximum percentage rise is in 2014 (28.57%). Therefore, the percentage rise in production with respect to the previous year is maximum for Company Y in the year 2014.


 English
 100 Questions
 100 Marks
 90 Mins