arrow
arrow
arrow
The following pie diagram shows the total expenditure (in percentage) incurred by 'X' in one month. Answer the given question based on the pie diagram
Question

The following pie diagram shows the total expenditure (in percentage) incurred by 'X' in one month. Answer the given question based on the pie diagram.

The highest percentage of total expenditure is incurred on:

A.

food and Health

B.

Health and Clothes

C.

Food and Other Expenses

D.

Clothes and Food

Correct option is C

Solution: 

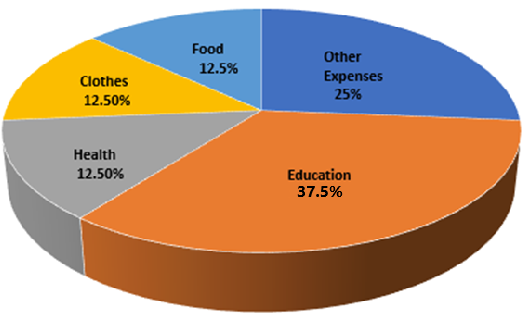
Share of Food and Other Expenses = 12.5 + 25 = 37.5%

Share of Clothes and Food = 12.5 + 12.5 = 25%

Share of Health and Clothes = 12.5 + 12.5 = 25%

Share of Food and Health = 12.5 + 12.5 = 25%

Therefore, the highest percentage of total expenditure is incurred on Food and Other Expenses.

Free Tests

Free
Must Attempt

CBT-1 Full Mock Test 1

languageIcon English
  • pdpQsnIcon100 Questions
  • pdpsheetsIcon100 Marks
  • timerIcon90 Mins
languageIcon English
Free
Must Attempt

RRB NTPC Graduate Level PYP (Held on 5 Jun 2025 S1)

languageIcon English
  • pdpQsnIcon100 Questions
  • pdpsheetsIcon100 Marks
  • timerIcon90 Mins
languageIcon English
Free
Must Attempt

CBT-1 General Awareness Section Test 1

languageIcon English
  • pdpQsnIcon40 Questions
  • pdpsheetsIcon30 Marks
  • timerIcon25 Mins
languageIcon English

Similar Questions

test-prime-package

Access ‘RRB NTPC’ Mock Tests with

  • 60000+ Mocks and Previous Year Papers
  • Unlimited Re-Attempts
  • Personalised Report Card
  • 500% Refund on Final Selection
  • Largest Community
students-icon
354k+ students have already unlocked exclusive benefits with Test Prime!
Our Plans
Monthsup-arrow