Correct option is D
Given:
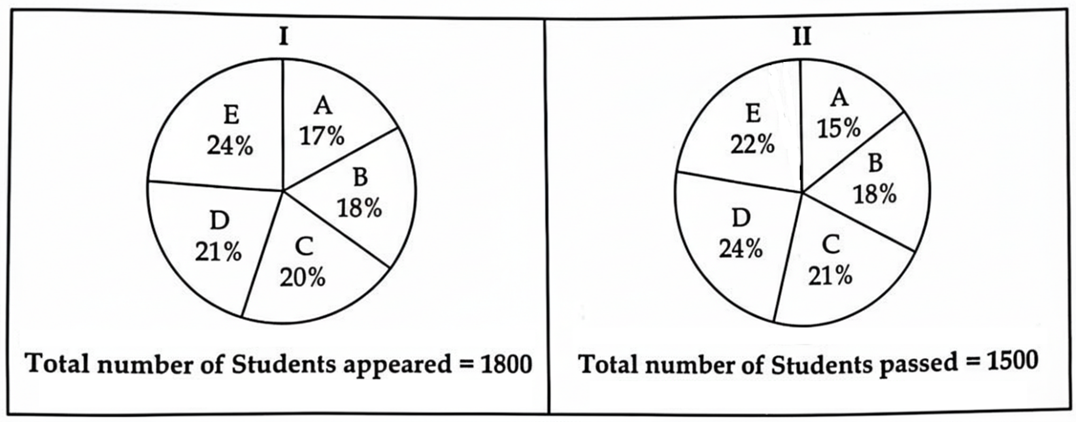
Total appeared students = 1800
in the pie chart,
Angle measure for appeared student in section A for exam = 420
Angle measure for appeared student in section B for exam = 500
Formula Used:
Difference of number of students in A and B;
=
Solution:
Difference between angle measure of A and B = 50 - 42 = 8

thus, the difference of students appeared in A and B section is 40.
 English
 100 Questions
 200 Marks
 60 Mins