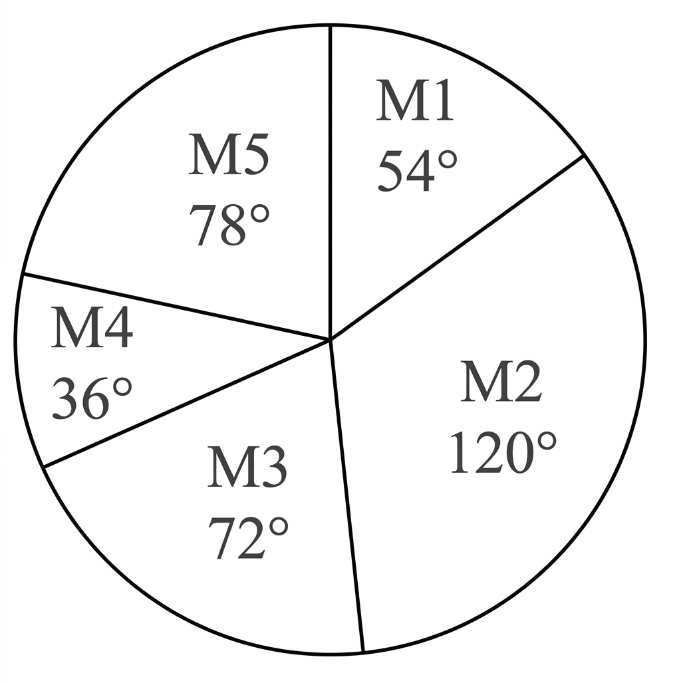
arrow
arrow
arrow
The following pie chart shows the number of people of various occupation in terms of percentage from different states of India.For the farmer sector,
Question

The following pie chart shows the number of people of various occupation in terms of percentage from different states of India.

For the farmer sector, what is the approximate measure of the central angle?

A.

35°

B.

25°

C.

30°

D.

40°

Correct option is D

Given:

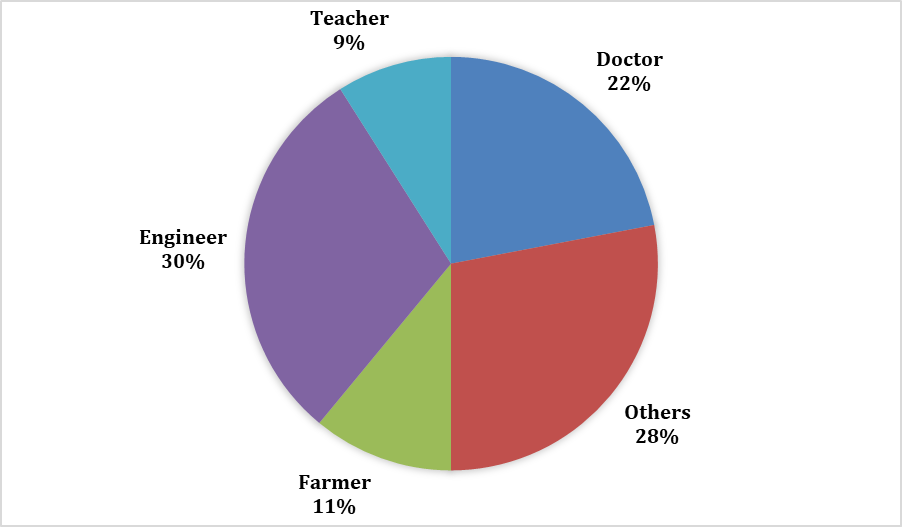
The pie chart represents the percentage distribution of different occupations.

Farmer sector = 11% of the total.

A full circle (pie chart) has 360°.

Concept Used:

The central angle for a sector in a pie chart is given by:

Central Angle=(Percentage100)×360\text{Central Angle} = \left(\frac{\text{Percentage}}{100}\right) \times 360^\circ​​

Solution:

For the Farmer sector (11%):

Central Angle=(11100)×360=39.6.\text{Central Angle} = \left(\frac{11}{100}\right) \times 360 =39.6^\circ.​​

The approximate measure of the central angle for the farmer sector is 40.40^\circ.

Option (D) is right.

Free Tests

Free
Must Attempt

CBT-1 Full Mock Test 1

languageIcon English
  • pdpQsnIcon100 Questions
  • pdpsheetsIcon100 Marks
  • timerIcon90 Mins
languageIcon English
Free
Must Attempt

RRB NTPC Graduate Level PYP (Held on 5 Jun 2025 S1)

languageIcon English
  • pdpQsnIcon100 Questions
  • pdpsheetsIcon100 Marks
  • timerIcon90 Mins
languageIcon English
Free
Must Attempt

RRB NTPC UG Level PYP (Held on 7 Aug 2025 S1)

languageIcon English
  • pdpQsnIcon100 Questions
  • pdpsheetsIcon100 Marks
  • timerIcon90 Mins
languageIcon English

Similar Questions

test-prime-package

Access ‘RRB NTPC’ Mock Tests with

  • 60000+ Mocks and Previous Year Papers
  • Unlimited Re-Attempts
  • Personalised Report Card
  • 500% Refund on Final Selection
  • Largest Community
students-icon
368k+ students have already unlocked exclusive benefits with Test Prime!
Our Plans
Monthsup-arrow