Correct option is B
Number of people coming from R having age group
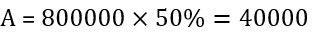
Those coming from Q having age group

Difference = 48000-40000 = 8000


Number of people coming from R having age group
Those coming from Q having age group
Difference = 48000-40000 = 8000
 English
 10 Questions
 10 Marks
 10 Mins English English120 Questions120 Marks120 Mins English English100 Questions300 Marks120 Mins English
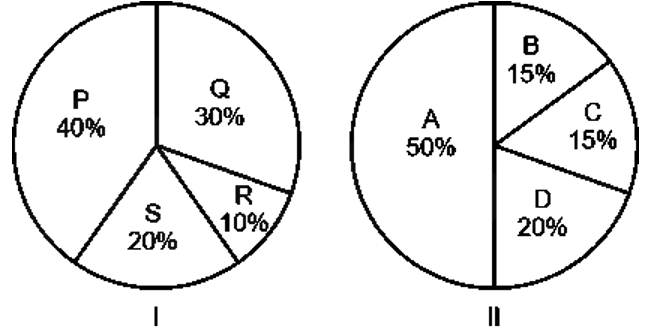
Pie-chart I shows the distribution of students who appeared in Board examination from schools A, B, C, D and E and pie-chart II shows the
distribution of students who passed the examination from these schools. Read both these pie-charts and answer the question :
The total number of students who failed from schools B and D is what percent of the total number of students who passed from schools A and C?
Study the following pie chart carefully and answer the question that follows :
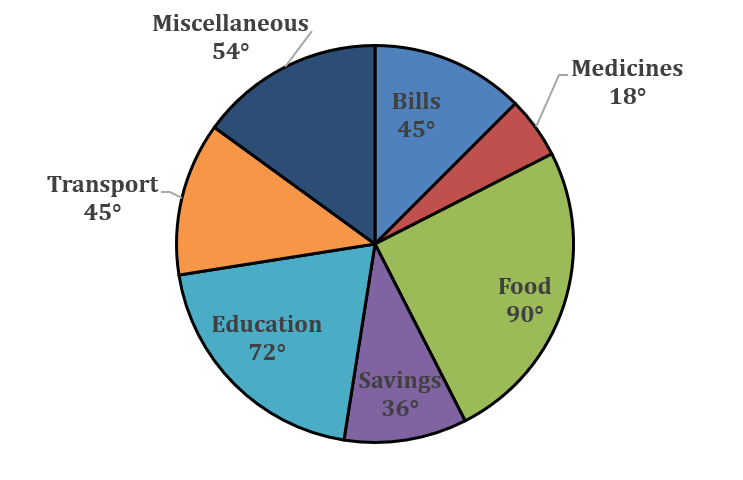
If the above pie chart shows the monthly expenditure of a family with monthly income ₹50,000, then find the ratio of the amount of 'Savings' to the amount spent on 'Food' :
Monthly budget of a family is shown in the pie chart. (The degree of Misc., Ent and Saving are same.)
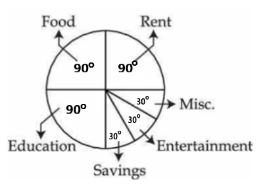
If savings of the family is ₹ 750, then monthly income is :
Monthly budget of a family is shown in the pie chart.
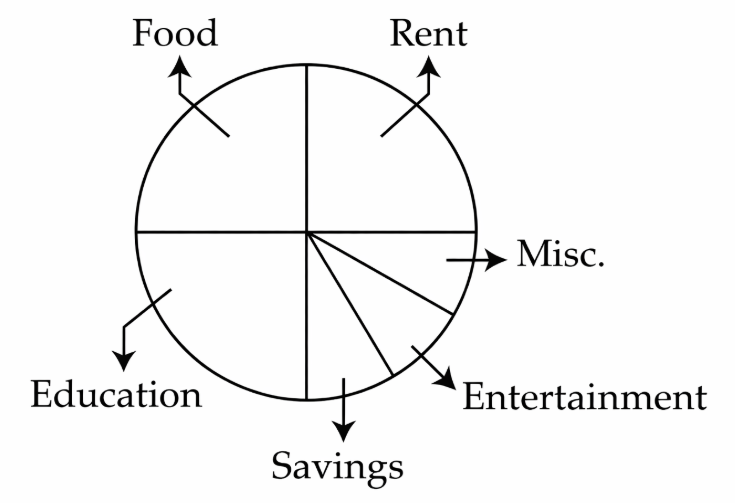
If savings of family is 750, then monthly income is :
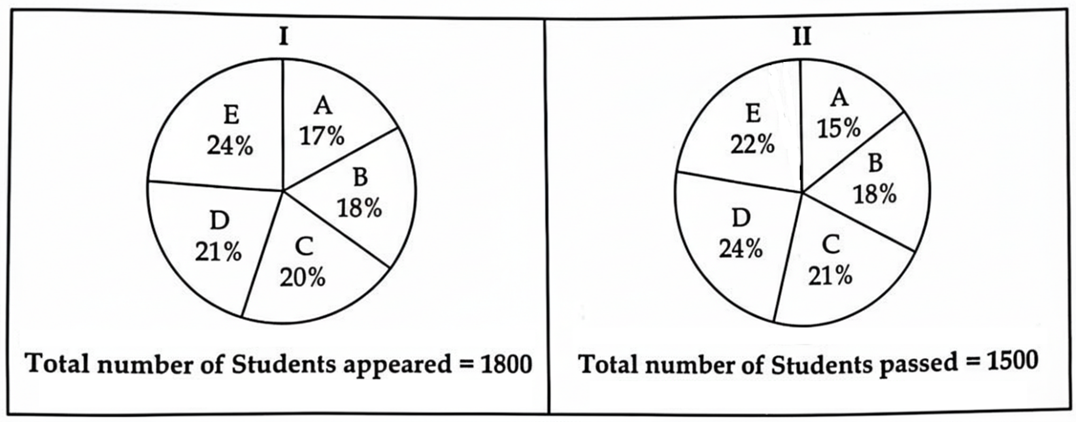
Study the following pie-chart and answer the question given below.
Breakup (degree wise) of the number of students studying in classes VI to X in a school
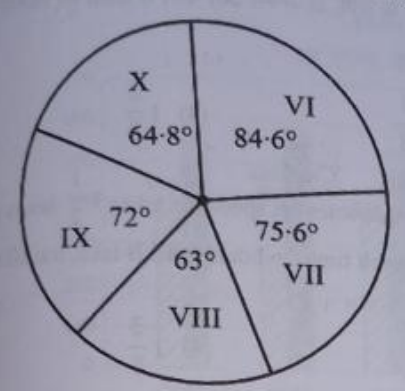
Number of students in Class VIII = 155
In Class IX, the ratio of boys and girls is 2 : 3 and 55 % of the students in Class X are girls.
The numberof girls in Class X is what percent more than the number of boys in Class IX?
The following chart givens the expenditure incurred by a publisher to bring out a book.
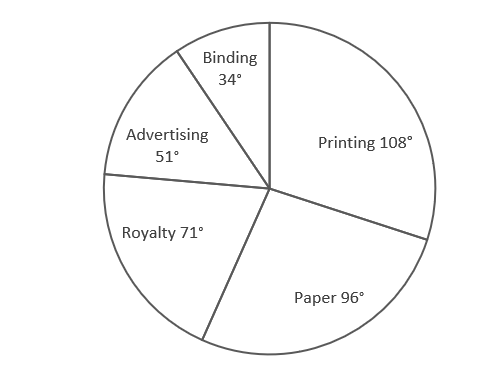
Find the percentage of the total expenditure incurred for printing.
The pie graph given below shows the expenditure on various sports in a particular year of a country. Read the graph carefully and then answer the given question.
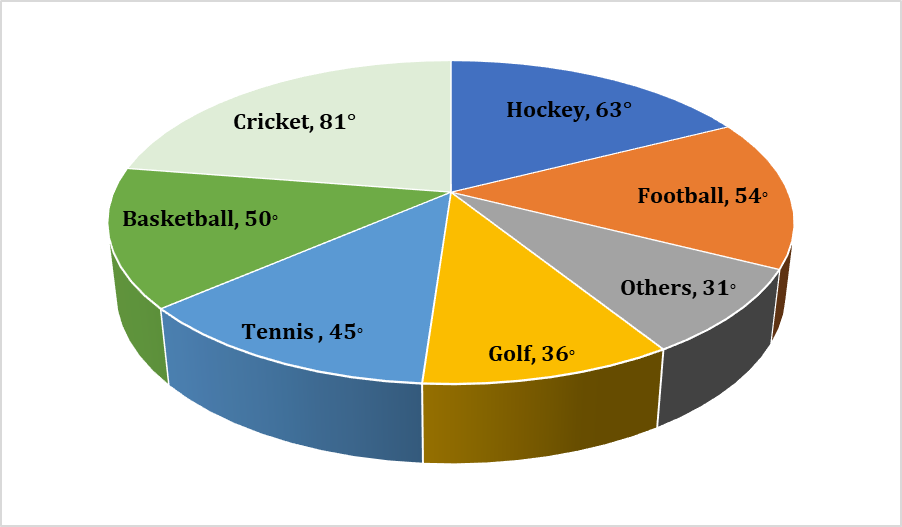
What percent more was spent on hockey than golf?
Out of the total population of all the cities 35% are females and 55% of the total population of city D are females. Total females in all the cities except D is how many more/ less than total population of A?
The population of cities D and E is what percentage more or less than the total population of A and C?
The pie chart given here shows expenditures incurred by a family on various items and their savings, which amount to Rs. 18,000 in a month.
Study the chart and answer the question based on the pie chart.
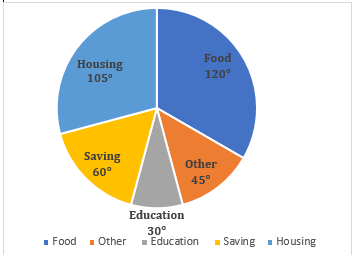
How much more amount is spent on food than on housing?

Suggested Test Series

Suggested Test Series