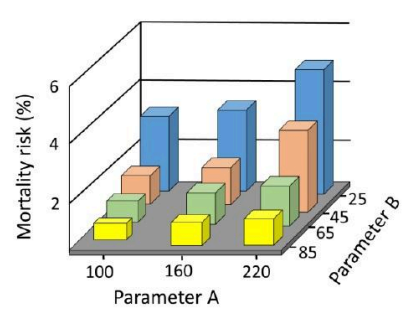
arrow
arrow
arrow
The following graph shows the mortality risk of a disease with respect to parameters A and B. Which of the following combinations of parameters is as
Question

The following graph shows the mortality risk of a disease with respect to parameters A and B.

Which of the following combinations of parameters is associated with the lowest mortality risk?

A.

The lowest value of A-B

B.

The lowest value of B-A

C.

The lowest values of both A and B

D.

The highest values of both A and B

Correct option is A

Observations:

  1. Parameter A Values: 100, 160, 220
  2. Parameter B Values: 25, 45, 65, 85
  3. The bars represent mortality risk percentages, with shorter bars indicating lower risks.

Step-by-Step Analysis:

  1. From the graph, the lowest bar (indicating the lowest mortality risk) is located at:

    • Parameter A = 100
    • Parameter B = 85
  2. The difference between A and B for this combination is:
    A - B = 100 - 85 = 15

  3. This value (15) is the lowest value of A - B across all parameter combinations.

Final Answer:

The correct option is (a):
"The lowest value of A - B."

Similar Questions

test-prime-package

Access ‘CSIR NET- GENERAL APTITUDE’ Mock Tests with

  • 60000+ Mocks and Previous Year Papers
  • Unlimited Re-Attempts
  • Personalised Report Card
  • 500% Refund on Final Selection
  • Largest Community
students-icon
354k+ students have already unlocked exclusive benefits with Test Prime!
Our Plans
Monthsup-arrow