arrow
arrow
arrow
The following bar graph shows the sales of bicycle (in thousand numbers) from five different shops, A, B, C, D and E, in 2017 and 2018.What is the rat
Question

The following bar graph shows the sales of bicycle (in thousand numbers) from five different shops, A, B, C, D and E, in 2017 and 2018.

What is the ratio of the total sales of shop C for both the years to the total sales of shop E for both the years?

A.

29 : 31

B.

35 : 31

C.

31 : 35

D.

4 : 5

Correct option is C

Given:

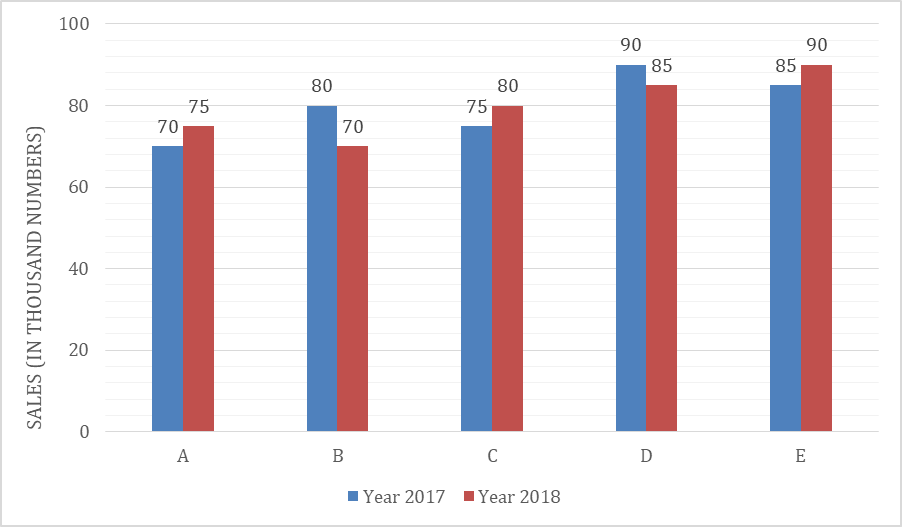
We need to find the ratio of the total sales of shop C for both years to the total sales of shop E for both years.

Concept Used:

The required ratio is:

Total Sales of CTotal Sales of E\frac{\text{Total Sales of C}}{\text{Total Sales of E}} ​​​

Solution:

Calculate Total Sales

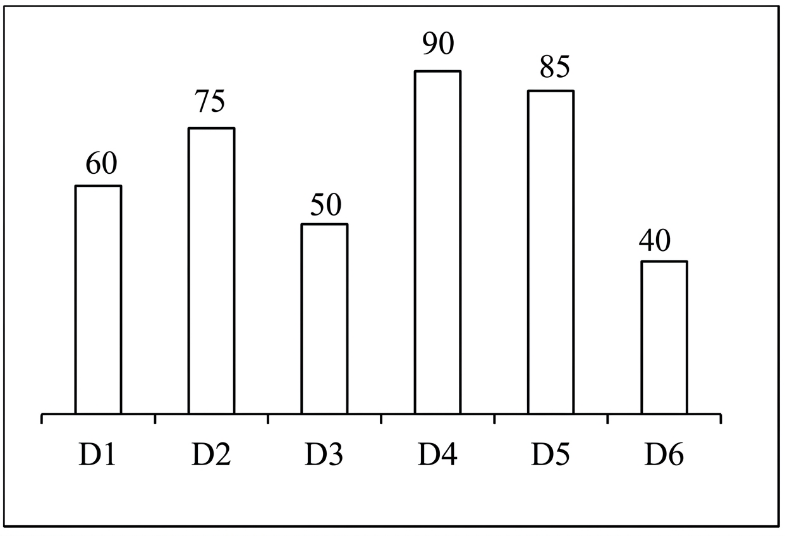
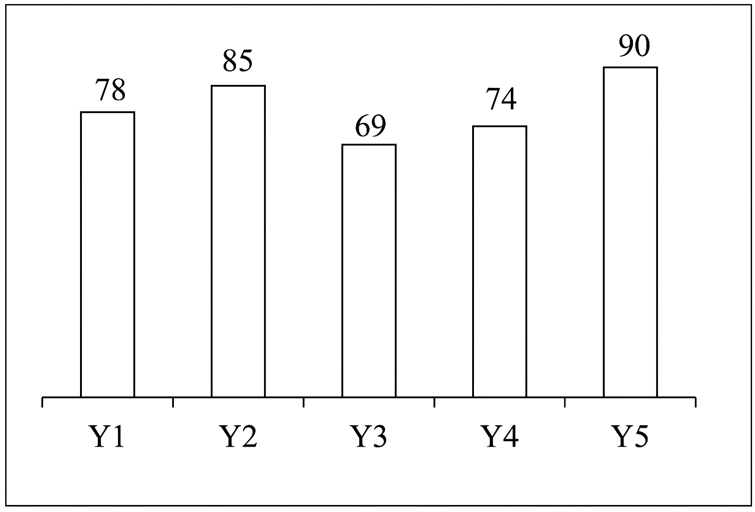
Total sales of Shop C: 75+80=155

Total sales of Shop E: 85+90=175

Find the Ratio

155175=3135\frac{155}{175} = \frac{31}{35}

Option (c) is right.

Free Tests

Free
Must Attempt

CBT-1 Full Mock Test 1

languageIcon English
  • pdpQsnIcon100 Questions
  • pdpsheetsIcon100 Marks
  • timerIcon90 Mins
languageIcon English
Free
Must Attempt

RRB NTPC Graduate Level PYP (Held on 5 Jun 2025 S1)

languageIcon English
  • pdpQsnIcon100 Questions
  • pdpsheetsIcon100 Marks
  • timerIcon90 Mins
languageIcon English
Free
Must Attempt

CBT-1 General Awareness Section Test 1

languageIcon English
  • pdpQsnIcon40 Questions
  • pdpsheetsIcon30 Marks
  • timerIcon25 Mins
languageIcon English

Similar Questions

test-prime-package

Access ‘RRB NTPC’ Mock Tests with

  • 60000+ Mocks and Previous Year Papers
  • Unlimited Re-Attempts
  • Personalised Report Card
  • 500% Refund on Final Selection
  • Largest Community
students-icon
354k+ students have already unlocked exclusive benefits with Test Prime!
Our Plans
Monthsup-arrow