hamburger menu
All Coursesall course arrow
adda247
reward-icon
adda247
    arrow
    arrow
    arrow
    The following bar graph shows the production of electric irons (in thousand numbers) by three companies P. Q and R over 6 years (from 2013 to 2018). A
    Question

    The following bar graph shows the production of electric irons (in thousand numbers) by three companies P. Q and R over 6 years (from 2013 to 2018). Answer the given question based on the bar graph.

    For company Q, what is the approximate percentage increase in the production of electric irons from 2013 to 2016?

    A.

    65%

    B.

    50%

    C.

    60%

    D.

    57%

    Correct option is B

    Given:
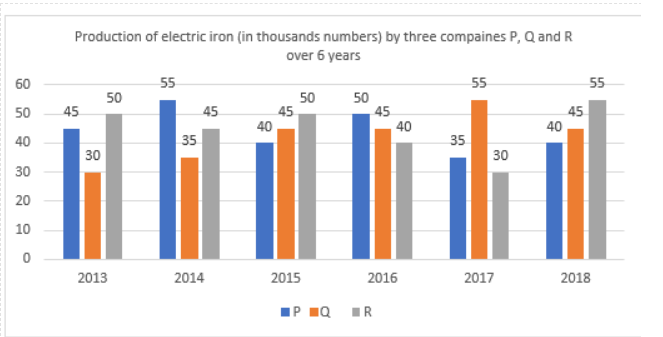
    Production of electric irons in 2013 for company Q = 30000 (assumed for explanation purposes)
    Production in 2016 for company Q = 45000

    Formula Used:
    Percentage increase = (New Value - Old Value) / Old Value × 100

    Solution:
    Increase = 45000 - 30000 = 15000
    Percentage increase = (15000 / 30000) × 100 = 50%

    Free Tests

    Free
    Must Attempt

    CBT-1 Full Mock Test 1

    languageIcon English
    • pdpQsnIcon100 Questions
    • pdpsheetsIcon100 Marks
    • timerIcon90 Mins
    languageIcon English
    Free
    Must Attempt

    RRB NTPC UG Level PYP (Held on 7 Aug 2025 S1)

    languageIcon English
    • pdpQsnIcon100 Questions
    • pdpsheetsIcon100 Marks
    • timerIcon90 Mins
    languageIcon English
    Free
    Must Attempt

    CBT-1 General Awareness Section Test 1

    languageIcon English
    • pdpQsnIcon40 Questions
    • pdpsheetsIcon30 Marks
    • timerIcon25 Mins
    languageIcon English

    Similar Questions

    test-prime-package

    Access ‘RRB NTPC’ Mock Tests with

    • 60000+ Mocks and Previous Year Papers
    • Unlimited Re-Attempts
    • Personalised Report Card
    • 500% Refund on Final Selection
    • Largest Community
    students-icon
    383k+ students have already unlocked exclusive benefits with Test Prime!
    Our Plans
    Monthsup-arrow