Correct option is A
Solution:
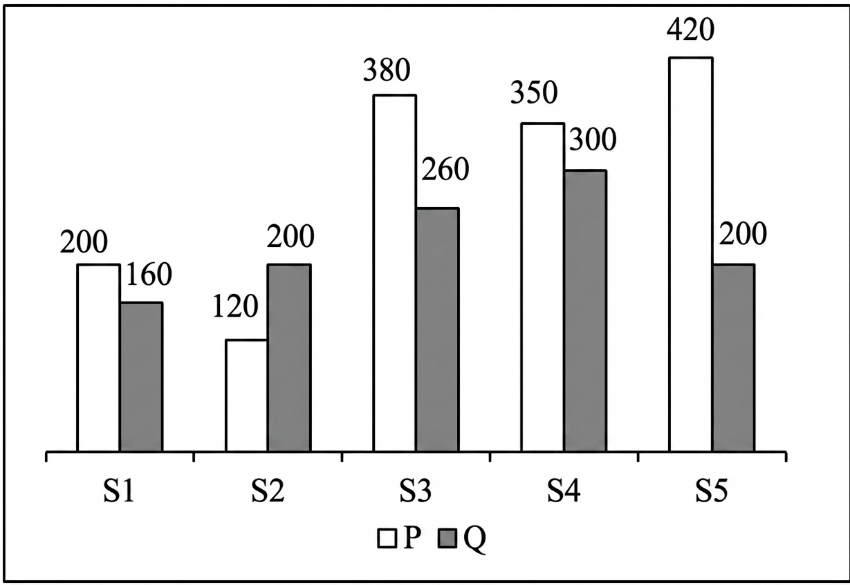
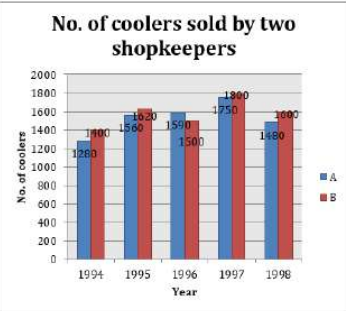
By Shopkeeper B
1995 = 1620, 1998 = 1600
Total (1995 + 1998) = 1620 + 1600 = 3220
by Shopkeeper A
1996: 1500,1997: 1750
Total (1996 + 1997) = 1590 + 1750 = 3340
Percentage =
As Shopkeeper A sell more than Shopkeeper B
Thus, Shopkeeper B sold 4% less than A
 English
 100 Questions
 100 Marks
 90 Mins