arrow
arrow
arrow
​The following bar graph shows the increase in the production of corn (in tons) over 4 years (from 2012 to 2015). Answer the given question based on t
Question

The following bar graph shows the increase in the production of corn (in tons) over 4 years (from 2012 to 2015). Answer the given question based on the bar graph.

What is the percentage increase (upto two decimal points) in the production of corn in 2015 as compared to the previous year?

A.

10.10%

B.

8.58%

C.

9.75%

D.

9.26%

Correct option is C

Given:

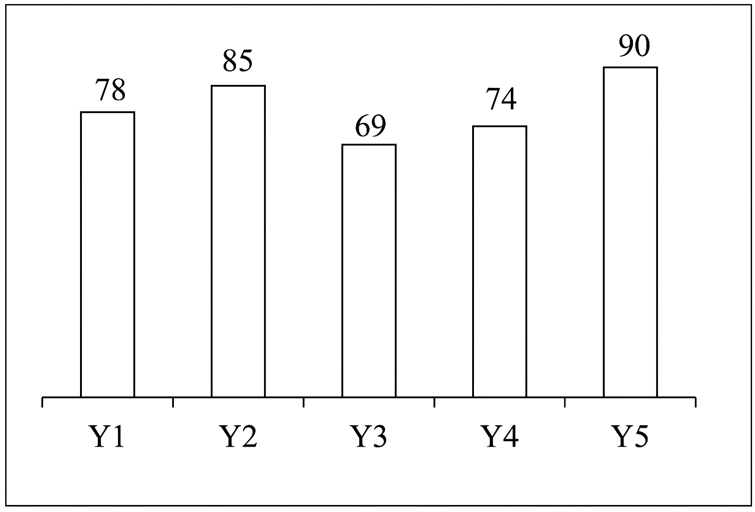
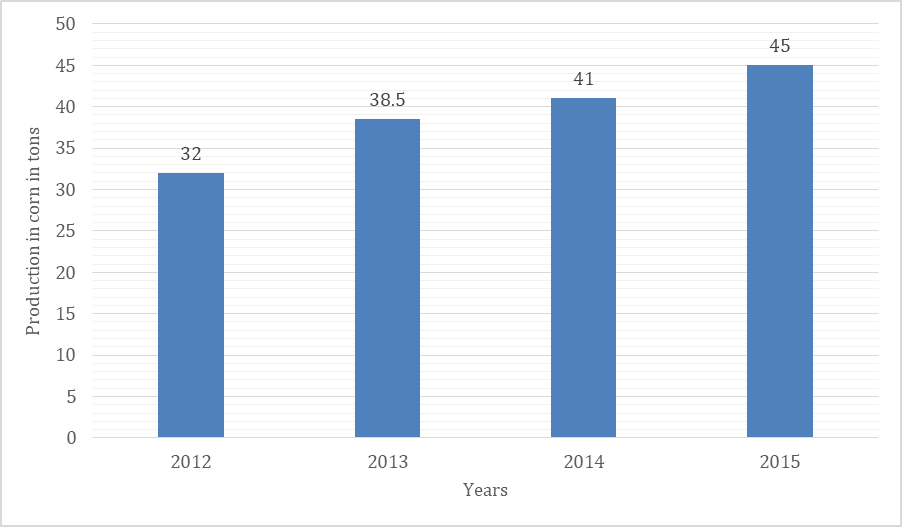
Production of corn in 2014 = 41 tons
Production of corn in 2015 = 45 tons

Formula Used:

Percentage Increase =(Increase in ProductionPrevious Year’s Production)×100 \left( \frac{\text{Increase in Production}}{\text{Previous Year's Production}} \right) \times 100​​

Solution:

Increase in production = 45 − 41= 4tons

Percentage Increase =(441)×100=9.75% \left( \frac{4}{41} \right) \times 100 = 9.75\%​​

Thus, The percentage increase in production in 2015 compared to 2014 is 9.75%.

Option (c) is right.

Free Tests

Free
Must Attempt

CBT-1 Full Mock Test 1

languageIcon English
  • pdpQsnIcon100 Questions
  • pdpsheetsIcon100 Marks
  • timerIcon90 Mins
languageIcon English
Free
Must Attempt

RRB NTPC Graduate Level PYP (Held on 5 Jun 2025 S1)

languageIcon English
  • pdpQsnIcon100 Questions
  • pdpsheetsIcon100 Marks
  • timerIcon90 Mins
languageIcon English
Free
Must Attempt

CBT-1 General Awareness Section Test 1

languageIcon English
  • pdpQsnIcon40 Questions
  • pdpsheetsIcon30 Marks
  • timerIcon25 Mins
languageIcon English

Similar Questions

test-prime-package

Access ‘RRB NTPC’ Mock Tests with

  • 60000+ Mocks and Previous Year Papers
  • Unlimited Re-Attempts
  • Personalised Report Card
  • 500% Refund on Final Selection
  • Largest Community
students-icon
353k+ students have already unlocked exclusive benefits with Test Prime!
Our Plans
Monthsup-arrow