Correct option is A


The bar graph given below shows number of male and female working in four different factories. Read the data carefully and answer the questions given below.
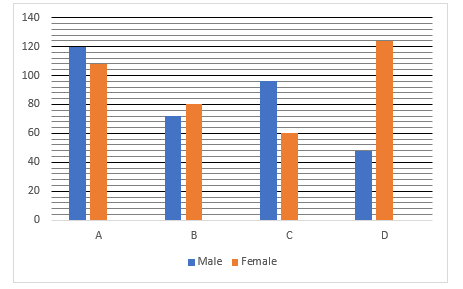
Required ratio = 72+48 : 108+80+60+124 = 120:372 = 10:31
Total work = 25% of 96×4+75% of 96×5= 96+360 = 456 units

 English
 100 Questions
 100 Marks
 60 Mins English English35 Questions35 Marks20 Mins English English35 Questions35 Marks20 Mins English
The line chart given below shows the number of calories burnt by a person on 6 consecutive days DY1, DY2, DY3, DY4, DY5 and DY6.
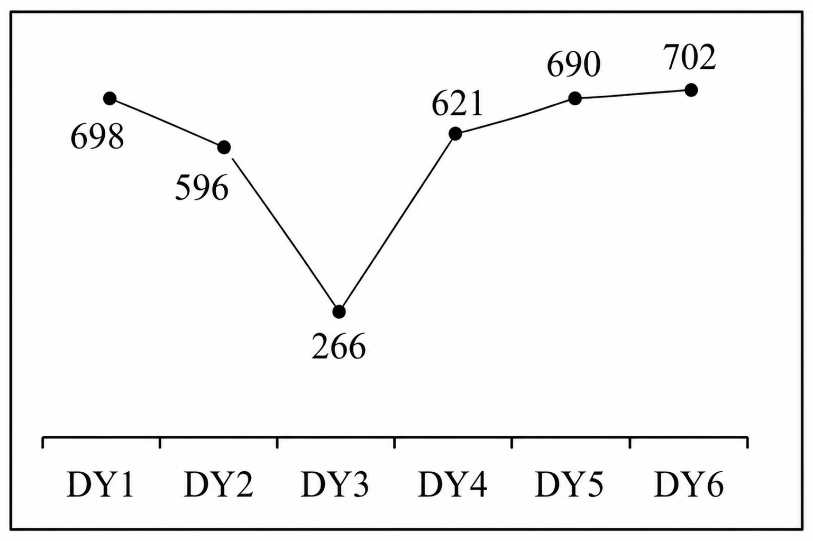
What is the average number of calories burnt by the person each day in the given 6 days?
The bar graph given below shows the number of mobile phones sold by the given 5 brands in a month.
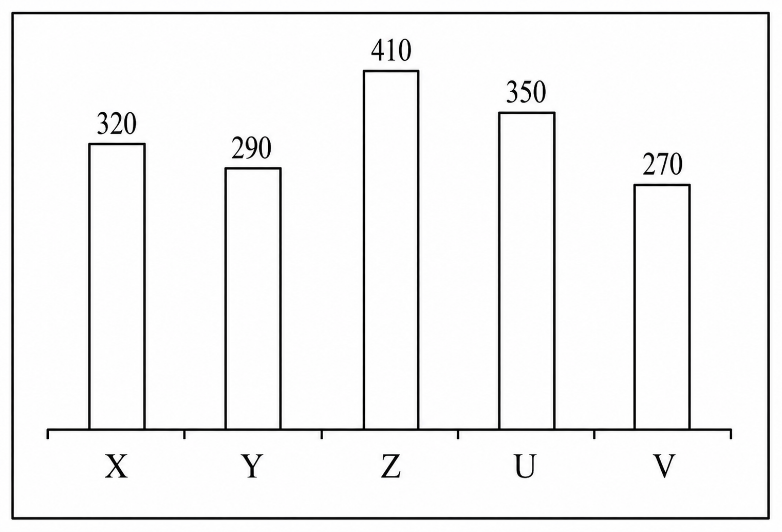
A = Total number of mobile phones sold by brand X and Y.
B = Total number of mobile phones sold by brand Z and U.
What is the value of A : B?
The pie chart given below shows the number of milk shops in 6 towns. The data is presented in the terms of percent.
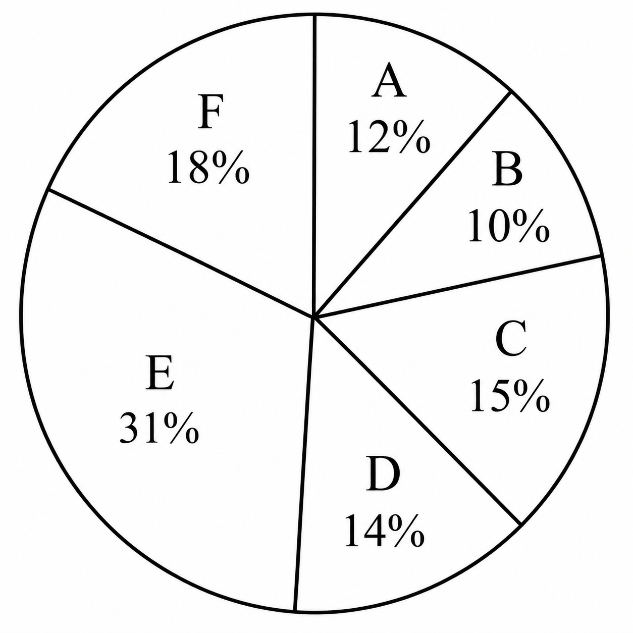
Central angle formed by sector of which town is 21.6 degrees more than the central angle formed by the sector of town A?
The pie chart given below shows the number of banks in 5 cities. The data is presented in the terms of percent. Difference between the total number of banks in N and Q and total number of banks in L and M = 2500.
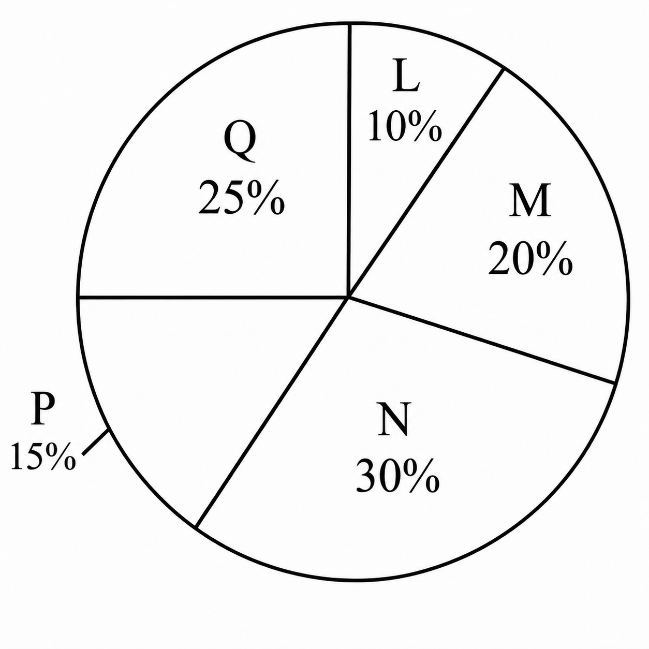
What is the ratio of number of banks in N to the total number of banks in P and Q?
The bar graph given below shows the number of male voters (P) and female voters (Q) in 5 states.
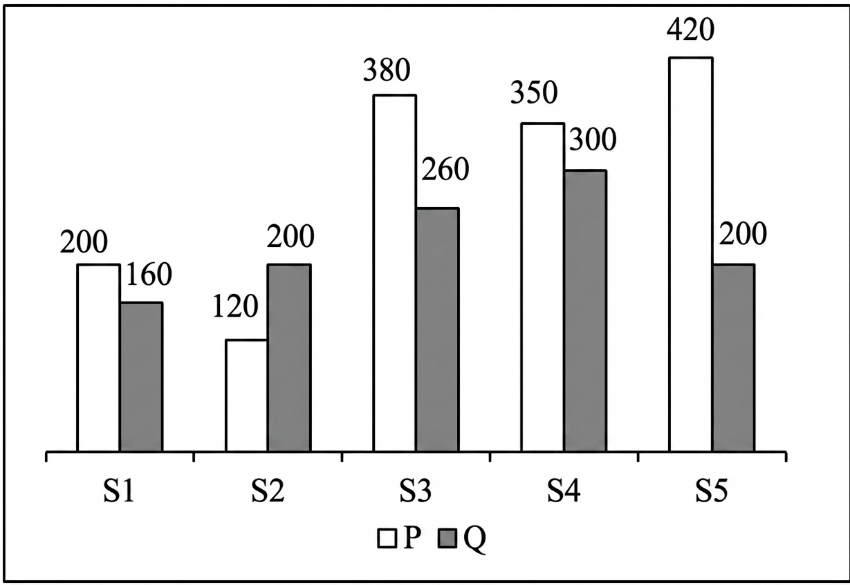
Which of the following statement is correct?
I. In state S2, female voters are 80 more than male voters.
II. In state S4, male voters are 50 more than female voters.
The bar graph given below shows the income of a person on the given 6 days.
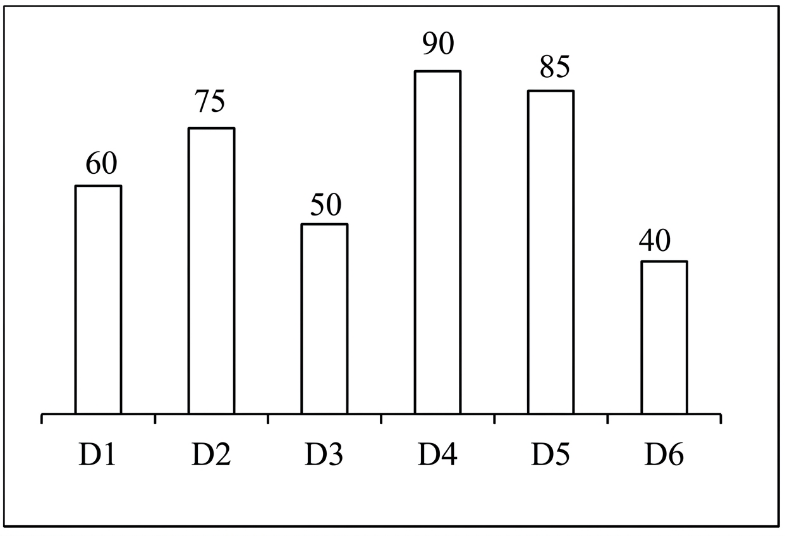
What is the average income of the person on the given 6 days?
The line chart given below shows the number of tickets sold (in '000) for 5 cricket matches TM1, TM2, TM3, TM4 and TM5.
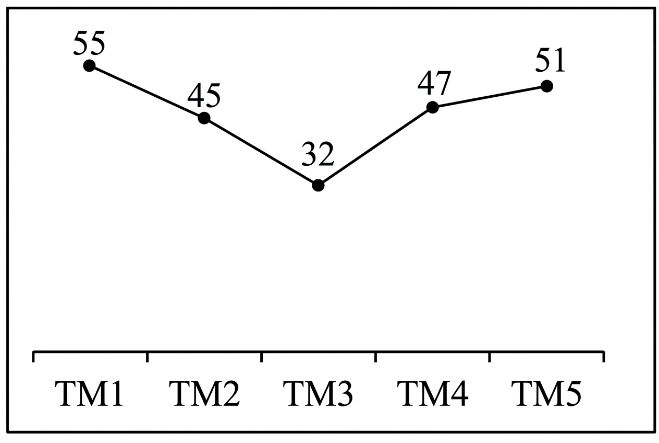
For the given 5 matches, what is the average number of tickets sold per match?
The line chart given below shows the monthly petrol consumption (in litres) by 6 different cars CR1, CR2, CR3, CR4, CR5 and CR6.
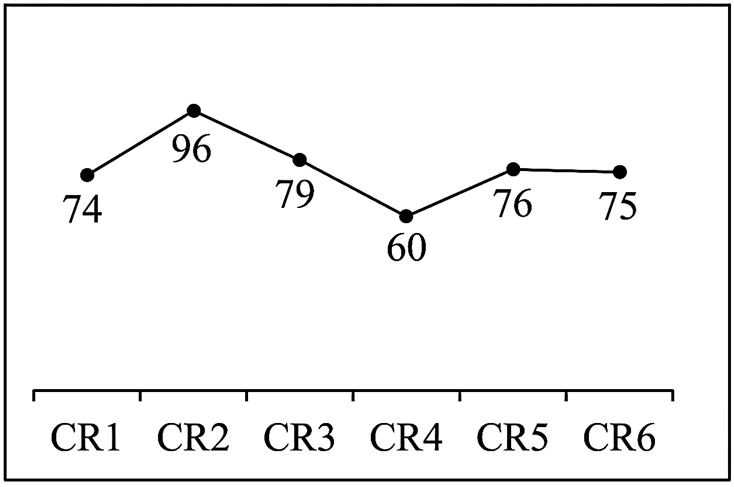
What is the average monthly consumption (in litres) of petrol per car for these 6 cars?
The pie chart given below shows the runs scored by a batsman in 6 matches. The data is presented in the terms of degrees.
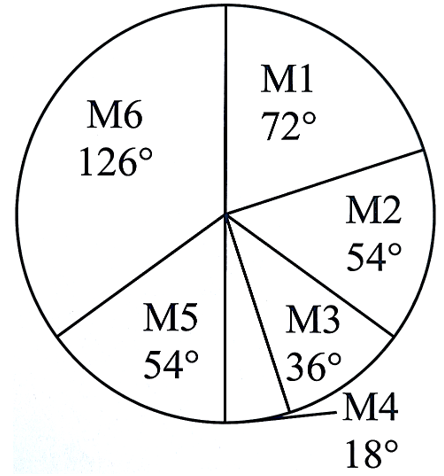
Total runs scored by the batsman in M6 and M5 are 240. What are the total runs scored by the batsman in M2 and M3?
The table given below shows the number of pens in the 8 shops.
A | 100 |
B | 800 |
C | 200 |
D | 450 |
E | 500 |
F | 600 |
G | 750 |
H | 700 |
S1 = Total number of pens in B, C and D.
S2 = Total number of pens in F, G and H.
What is the value of S1: S2?

Suggested Test Series

Suggested Test Series
The line chart given below shows the number of calories burnt by a person on 6 consecutive days DY1, DY2, DY3, DY4, DY5 and DY6.
What is the average number of calories burnt by the person each day in the given 6 days?
The bar graph given below shows the number of mobile phones sold by the given 5 brands in a month.
A = Total number of mobile phones sold by brand X and Y.
B = Total number of mobile phones sold by brand Z and U.
What is the value of A : B?
The pie chart given below shows the number of milk shops in 6 towns. The data is presented in the terms of percent.
Central angle formed by sector of which town is 21.6 degrees more than the central angle formed by the sector of town A?
The pie chart given below shows the number of banks in 5 cities. The data is presented in the terms of percent. Difference between the total number of banks in N and Q and total number of banks in L and M = 2500.
What is the ratio of number of banks in N to the total number of banks in P and Q?
The bar graph given below shows the number of male voters (P) and female voters (Q) in 5 states.
Which of the following statement is correct?
I. In state S2, female voters are 80 more than male voters.
II. In state S4, male voters are 50 more than female voters.
The bar graph given below shows the income of a person on the given 6 days.
What is the average income of the person on the given 6 days?
The line chart given below shows the number of tickets sold (in '000) for 5 cricket matches TM1, TM2, TM3, TM4 and TM5.
For the given 5 matches, what is the average number of tickets sold per match?
The line chart given below shows the monthly petrol consumption (in litres) by 6 different cars CR1, CR2, CR3, CR4, CR5 and CR6.
What is the average monthly consumption (in litres) of petrol per car for these 6 cars?
The pie chart given below shows the runs scored by a batsman in 6 matches. The data is presented in the terms of degrees.
Total runs scored by the batsman in M6 and M5 are 240. What are the total runs scored by the batsman in M2 and M3?
The table given below shows the number of pens in the 8 shops.
A | 100 |
B | 800 |
C | 200 |
D | 450 |
E | 500 |
F | 600 |
G | 750 |
H | 700 |
S1 = Total number of pens in B, C and D.
S2 = Total number of pens in F, G and H.
What is the value of S1: S2?