Correct option is D
Given:
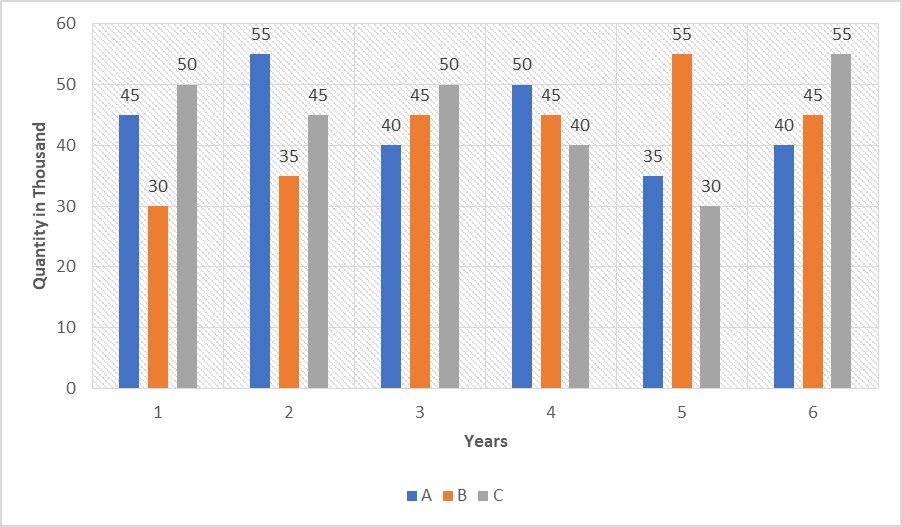
Company A:
Year 5: 35
Year 6: 40
Company C:
Year 5: 30
Year 6: 55
Solution:
Total production of grinders for the years 5 and 6 by C,
30 + 55 = 85
Total production of grinders for the years 5 and 6 by A,
35 + 40 = 75
Then, ratio of total production of grinders for the years 5 and 6 by C to total production of grinders for the years 5 and 6 by A,
85 : 75
= 17: 15
Thus, correct answer is option (D).
 English
 100 Questions
 100 Marks
 90 Mins