arrow
arrow
arrow
Study the given pie charts and answers the question that follows.The pie charts represent the values of sales and expenses of five companies A, B, C,
Question

Study the given pie charts and answers the question that follows.

The pie charts represent the values of sales and expenses of five companies A, B, C, D, E in terms of percentages.

Based on the visual reading of the pie-chart, which company is the most profitable in percentage terms.

A.

B

B.

D

C.

C

D.

A

Correct option is C

Given:

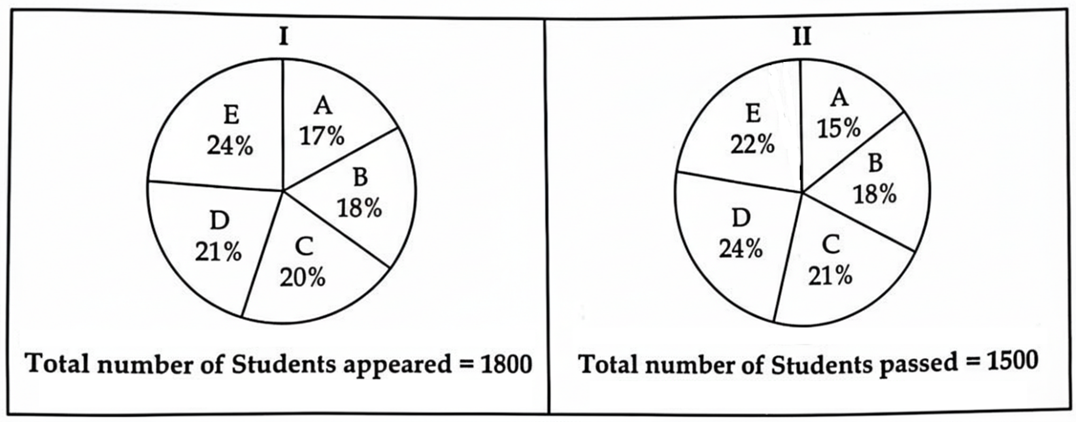
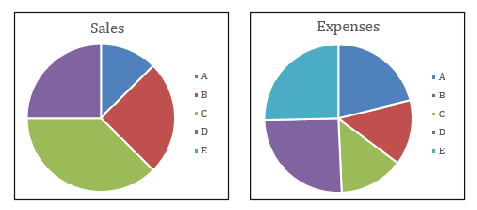
The pie charts show the sales and expenses distribution (in percentages) of five companies: A, B, C, D, and E.

Solution:

A company is the most profitable in percentage terms if its sales percentage is significantly higher than its expense percentage. The greater the difference (Sales % - Expenses %), the higher the profit percentage.

Company C has a significantly higher percentage in the sales chart than in the expenses chart.

This indicates that Company C is the most profitable in percentage terms. 

Thus Option (c) is correct 

Free Tests

Free
Must Attempt

CBT-1 Full Mock Test 1

languageIcon English
  • pdpQsnIcon100 Questions
  • pdpsheetsIcon100 Marks
  • timerIcon90 Mins
languageIcon English
Free
Must Attempt

RRB NTPC Graduate Level PYP (Held on 5 Jun 2025 S1)

languageIcon English
  • pdpQsnIcon100 Questions
  • pdpsheetsIcon100 Marks
  • timerIcon90 Mins
languageIcon English
Free
Must Attempt

CBT-1 General Awareness Section Test 1

languageIcon English
  • pdpQsnIcon40 Questions
  • pdpsheetsIcon30 Marks
  • timerIcon25 Mins
languageIcon English

Similar Questions

test-prime-package

Access ‘RRB NTPC’ Mock Tests with

  • 60000+ Mocks and Previous Year Papers
  • Unlimited Re-Attempts
  • Personalised Report Card
  • 500% Refund on Final Selection
  • Largest Community
students-icon
354k+ students have already unlocked exclusive benefits with Test Prime!
Our Plans
Monthsup-arrow