arrow
arrow
arrow
Study the given bar-graph and answer the question that follows. The bar-graph shows the production of refrigerators (in thousand) by five different
Question

Study the given bar-graph and answer the question that follows.
The bar-graph shows the production of refrigerators (in thousand) by five different companies A, B, C, D and E during 2004 to 2007.

What is the ratio of the average production of the refrigerators by companies A, B and E taken together for the year 2004-2005 to the average production of the refrigerators by companies C and D taken together for the year 2005-2006.

A.

41:19

B.

19:41

C.

19:43

D.

43:19

Correct option is C

Solution:
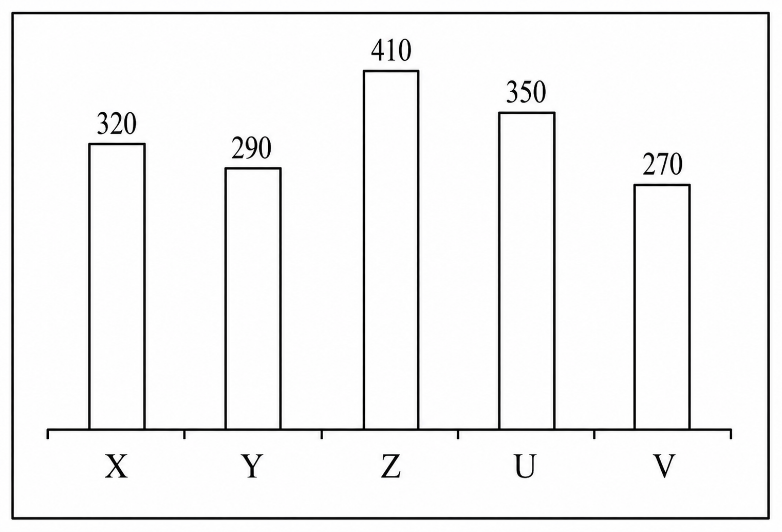
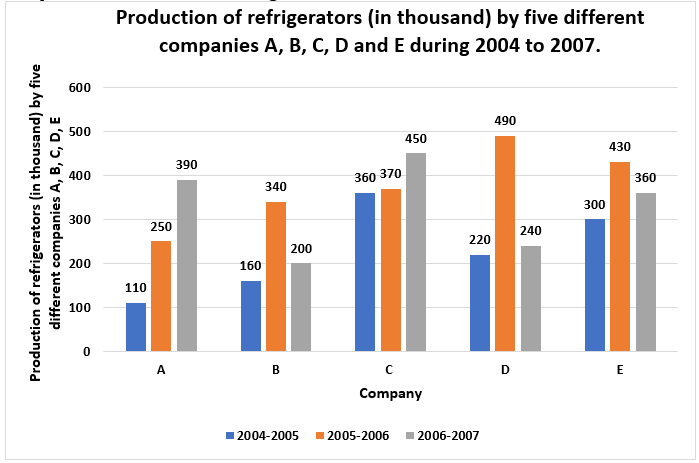
Average production of the refrigerators by companies A, B and E for the year 2004-2005= ​(110+160+300)3=5703=190\frac{(110 +160 +300 )}{3}= \frac{570}{3} =190​​
Average production of the refrigerators by companies C and D for the year 2005-2006 = (370+490)2=8602=430\frac{(370+490)}{2}=\frac{ 860}{2}=430​​
∴ Required ratio = 190 : 430 =19 : 43

Free Tests

Free
Must Attempt

SSC GD PYP (Held on 4 Feb 2025 S1)

languageIcon English
  • pdpQsnIcon80 Questions
  • pdpsheetsIcon160 Marks
  • timerIcon60 Mins
languageIcon English
Free
Must Attempt

Hindi Section Test 1

languageIcon English
  • pdpQsnIcon20 Questions
  • pdpsheetsIcon40 Marks
  • timerIcon12 Mins
languageIcon English
Free
Must Attempt

SSC GD Constable Full Mock Test 1

languageIcon English
  • pdpQsnIcon80 Questions
  • pdpsheetsIcon160 Marks
  • timerIcon60 Mins
languageIcon English

Similar Questions

test-prime-package

Access ‘SSC CHSL Tier I’ Mock Tests with

  • 60000+ Mocks and Previous Year Papers
  • Unlimited Re-Attempts
  • Personalised Report Card
  • 500% Refund on Final Selection
  • Largest Community
students-icon
368k+ students have already unlocked exclusive benefits with Test Prime!
Our Plans
Monthsup-arrow