arrow
arrow
arrow
Study the following graph showing the Profit and Expense of a Company from 2001 to 2006 and answer the question(Amounts in Lakhs).​For how many years
Question

Study the following graph showing the Profit and Expense of a Company from 2001 to 2006 and answer the question

(Amounts in Lakhs).

For how many years was the profit more than the average profit of the given years?

A.

3

B.

2

C.

4

D.

1

Correct option is A

Given:

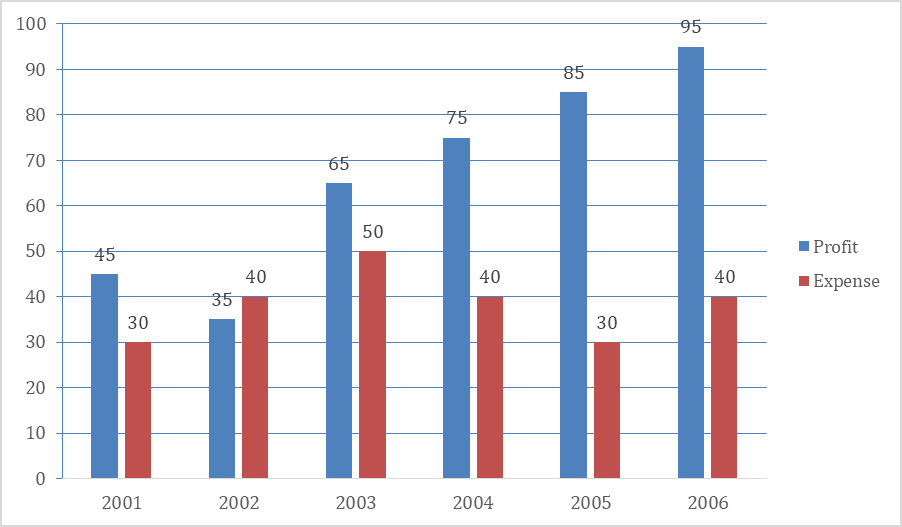
Profit values for the years from the graph:

2001: 45

2002: 35

2003: 65

2004: 75

2005: 85

2006: 95 

Solution:

Average profit=Total profitNumber of years =45+35+65+75+85+956\text{Average profit} = \frac{\text{Total profit}}{\text{Number of years}} \\ \ \\ = \frac{45 + 35 + 65 + 75 + 85 + 95}{6} 

Average profit=400666.67\text{Average profit} = \frac{400}{6} \approx 66.67 

Identify years where profit > average profit

2004: 75 (greater than 66.67)

2005: 85 (greater than 66.67)

2006: 95 (greater than 66.67)

Thus, Profit was greater than the average profit in 3 years (2004, 2005, and 2006)

Free Tests

Free
Must Attempt

RRB NTPC UG Level PYP (Held on 7 Aug 2025 S1)

languageIcon English
  • pdpQsnIcon100 Questions
  • pdpsheetsIcon100 Marks
  • timerIcon90 Mins
languageIcon English
Free
Must Attempt

CBT-1 Full Mock Test 1

languageIcon English
  • pdpQsnIcon100 Questions
  • pdpsheetsIcon100 Marks
  • timerIcon90 Mins
languageIcon English
Free
Must Attempt

RRB Group D Full Mock Test 1

languageIcon English
  • pdpQsnIcon100 Questions
  • pdpsheetsIcon100 Marks
  • timerIcon90 Mins
languageIcon English

Similar Questions

test-prime-package

Access ‘RRB NTPC’ Mock Tests with

  • 60000+ Mocks and Previous Year Papers
  • Unlimited Re-Attempts
  • Personalised Report Card
  • 500% Refund on Final Selection
  • Largest Community
students-icon
446k+ students have already unlocked exclusive benefits with Test Prime!

Similar Questions

Our Plans
Monthsup-arrow