Correct option is A
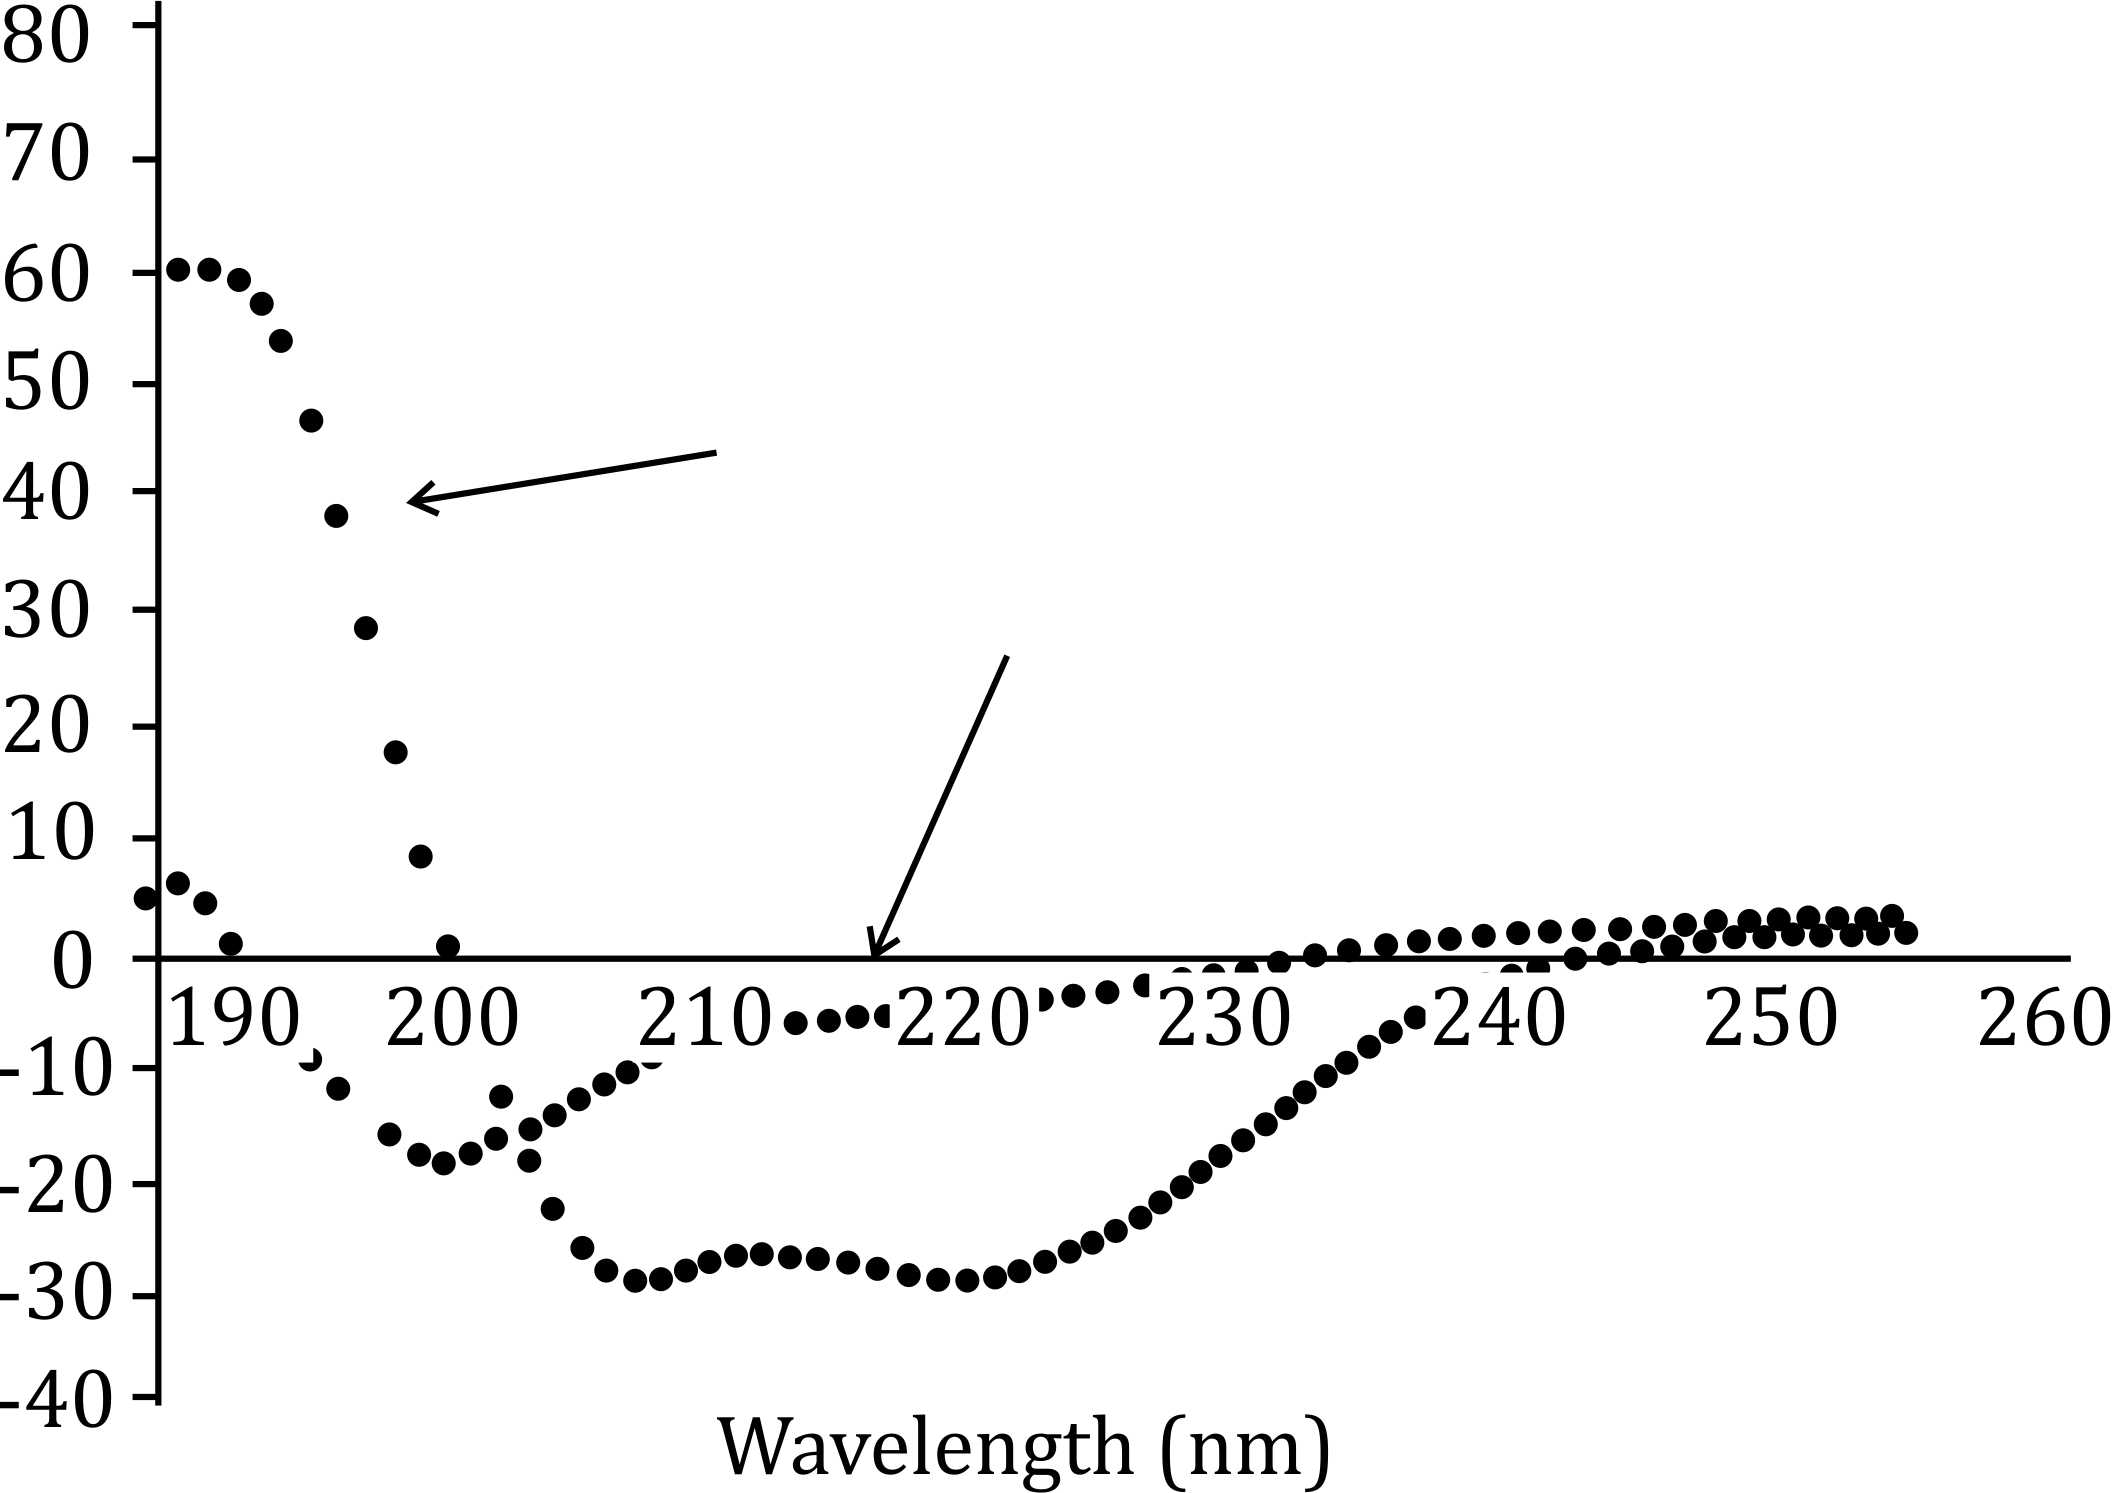
Sol. To interpret the given Circular Dichroism (CD) spectra, we must understand how secondary structures, such as α-helices and β-sheets, are reflected in the CD spectrum. In CD spectroscopy, the α-helical structure typically shows a characteristic positive band near 190 nm and a negative band around 208 and 222 nm. The β-sheet structure shows a characteristic negative band around 215 nm and a positive band around 190 nm, with different intensity patterns.
Explanation of Option 1:
Condition A shows an α-helical structure, which is typically characterized by the presence of negative peaks around 208 nm and 222 nm in CD spectra.
Condition B shows a loss of these characteristic α-helical bands and possibly a shift toward more unordered or less structured regions, which can be interpreted as denaturation. Denaturation does not necessarily mean a complete loss of structure, but a significant alteration where the protein loses its native secondary structure.
This supports the interpretation that under condition A, the protein has an α-helical secondary structure, which denatures under condition B.
Information Booster
The correct interpretation, Option 1, suggests that under condition A, the protein has an α-helical secondary structure, and under condition B, the protein undergoes denaturation. Denaturation results in the unfolding or loss of the ordered secondary structure (such as α-helices). The change in the CD spectrum from condition A to condition B indicates a reduction in α-helical content, which is characteristic of protein denaturation.
Additional Information
(2) The protein has α helical secondary structure under condition A that is converted to β sheets under condition B: This option would be true if the spectra showed a shift toward β-sheet features (e.g., a negative band at 215 nm and a positive band near 190 nm), which is not observed here. The change in the spectra does not correspond to a shift to β-sheets but rather a loss of structured α-helices, suggesting denaturation.
(3) The spectra represent the tertiary fold of the protein with condition A corresponding to mixed α helical + β sheet fold and condition B corresponding to largely β sheet fold: This is not accurate because CD spectra reflect secondary structure, not tertiary structure. The change seen here is more consistent with denaturation (unfolding or loss of structure), not a shift from one secondary structure fold (α-helical + β-sheet) to another (largely β-sheet).
(4) The difference between the spectra under conditions A and B is due to lower protein concentration under condition B: This is incorrect because the shape of the spectrum changes significantly between conditions A and B, which indicates a change in the secondary structure of the protein. If it were due to concentration differences, only the intensity of the peaks would change, not their position or the overall shape of the spectrum.