Correct option is C
Solution:
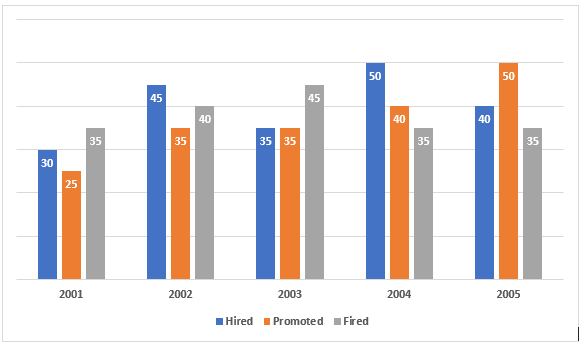
Number of employees who were fired in 2003 = 45
Number of employees who were promoted in 2001 = 25
Difference = 45 - 25 = 20.


Solution:
Number of employees who were fired in 2003 = 45
Number of employees who were promoted in 2001 = 25
Difference = 45 - 25 = 20.
 English
 100 Questions
 100 Marks
 90 Mins English English100 Questions100 Marks90 Mins English English40 Questions30 Marks25 Mins English
Find the smallest number which when increased by 20 is completely divisible by 12, 20, 15, 18 and 24.
The number of prime numbers lying between 300 and 305 is:
The LCM of the numbers 3.7 and 0.068 is:
The number of prime numbers lying between 323 and 332 is:
Find the Highest Common Factor (HCF) of 372, 732 and 2196.
What is the year before 2001 whose calendar is the same as 2001?

Suggested Test Series

Suggested Test Series