arrow
arrow
arrow
Observe the bar graph showing the number of students in different sections of a school and answer the question. Which section has nearly the average
Question

Observe the bar graph showing the number of students in different sections of a school and answer the question.

Which section has nearly the average number of students when compared with all the 6 sections of the graph?

A.

Sections 1 and 3

B.

Sections 4 and 5

C.

Sections 2 and 3

D.

Sections 4 and 6

Correct option is D

Solution:
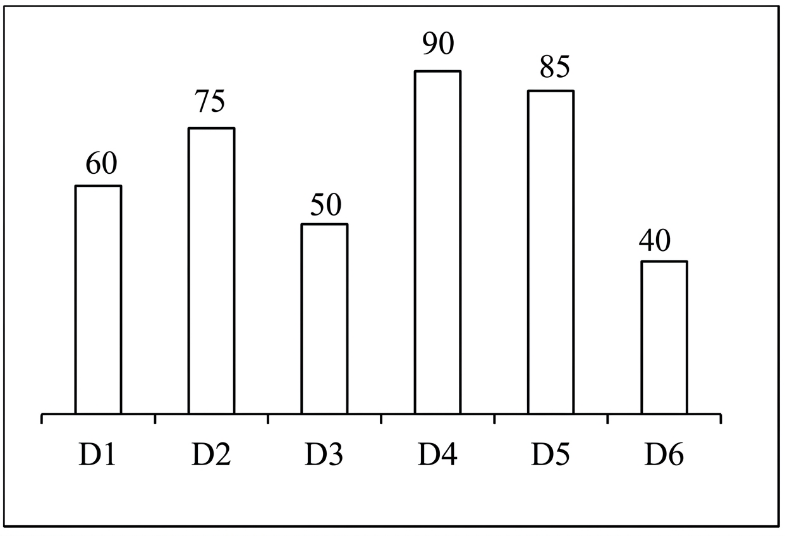
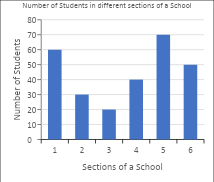
The average number of students in 6 sections = 60+30+20+40+70+506\frac{60 + 30 + 20 + 40 + 70 + 50} 6​ = 45
Average number of 4 and 5 sections = 40+702\frac{40 + 70} 2 ​= 55
Average number of 4 and 6 sections = 40+502\frac{40 + 50} 2​ = 45
Average number of 2 and 3 sections = 30+202\frac{30 + 20} 2 ​= 25
Average number of 1 and 3 sections = 60+202\frac{60 + 20} 2​ = 40
Hence option (d) is the valid answer.

Free Tests

Free
Must Attempt

CBT-1 Full Mock Test 1

languageIcon English
  • pdpQsnIcon100 Questions
  • pdpsheetsIcon100 Marks
  • timerIcon90 Mins
languageIcon English
Free
Must Attempt

RRB NTPC Graduate Level PYP (Held on 5 Jun 2025 S1)

languageIcon English
  • pdpQsnIcon100 Questions
  • pdpsheetsIcon100 Marks
  • timerIcon90 Mins
languageIcon English
Free
Must Attempt

CBT-1 General Awareness Section Test 1

languageIcon English
  • pdpQsnIcon40 Questions
  • pdpsheetsIcon30 Marks
  • timerIcon25 Mins
languageIcon English

Similar Questions

test-prime-package

Access ‘RRB NTPC’ Mock Tests with

  • 60000+ Mocks and Previous Year Papers
  • Unlimited Re-Attempts
  • Personalised Report Card
  • 500% Refund on Final Selection
  • Largest Community
students-icon
353k+ students have already unlocked exclusive benefits with Test Prime!
Our Plans
Monthsup-arrow