


Correct option is A
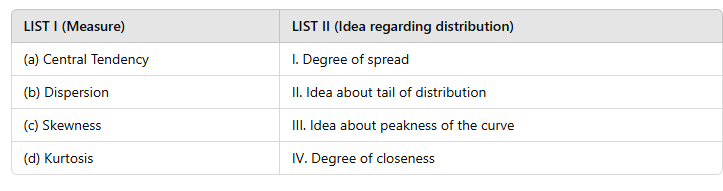
1. Central Tendency (A-IV):
· Central tendency refers to the measure that identifies the central point of a data set. This relates to the degree of closeness of data points around a central value.
2. Dispersion (B-I):
· Dispersion measures the spread of data points around the central tendency. Therefore, it is associated with the degree of spread.
3. Skewness (C-II):
· Skewness indicates the asymmetry or the tail of the distribution, referring to whether the data leans more towards the left or the right.
4. Kurtosis (D-III):
· Kurtosis measures the peakness of the distribution curve. It tells us if the distribution is more flat or more peaked compared to a normal distribution.
Therefore, the correct match is A-IV, B-I, C-II, D-III.
Information Booster 1. Central Tendency:
· Measures include Mean, Median, and Mode.
· Focuses on identifying the central point in the dataset.
2. Dispersion:
· Measures include Range, Variance, and Standard Deviation.
· Indicates how spread out the data points are.
3. Skewness:
· Positive skew (right-skewed): The tail extends to the right.
· Negative skew (left-skewed): The tail extends to the left.
4. Kurtosis:
· Types:
· Leptokurtic: Peaked distribution.
· Platykurtic: Flatter distribution.
· Mesokurtic: Normal peak distribution.
Additional Knowledge · (a) Central Tendency – IV (Degree of closeness): Measures how closely the data points are clustered around a central value.
· (b) Dispersion – I (Degree of spread): Describes the variability or spread of data points.
· (c) Skewness – II (Idea about tail of distribution): Determines the asymmetry of data distribution.
· (d) Kurtosis – III (Idea about peakness of the curve): Reflects the sharpness of the peak in the data distribution.
 English
 10 Questions
 20 Marks
 12 Mins
