hamburger menu
All Coursesall course arrow
adda247
reward-icon
adda247
    arrow
    arrow
    arrow
    In the figure log10y is plotted against log10x When y is plotted against x, then the plot in the provided range is
    Question

    In the figure log10y is plotted against log10x

    When y is plotted against x, then the plot in the provided range is

    A.

    B.

    C.

    D.

    Correct option is A

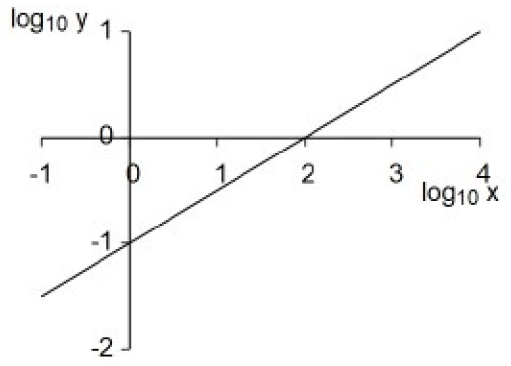
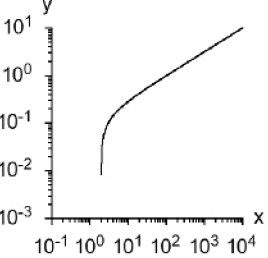
    The given figure shows a plot of log10(y) against log10(x), which is a straight line.

    This indicates a logarithmic relationship between y and x.

    When you plot y against x directly (i.e., removing the logarithms), you expect a power law relationship.

    Given that the plot of log10(y) vs log10(x) is a straight line, this implies that: log10y = mlog10​x+c

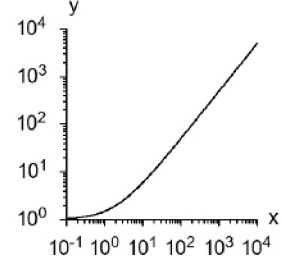
    which translates to:

    y = 10c​.xm

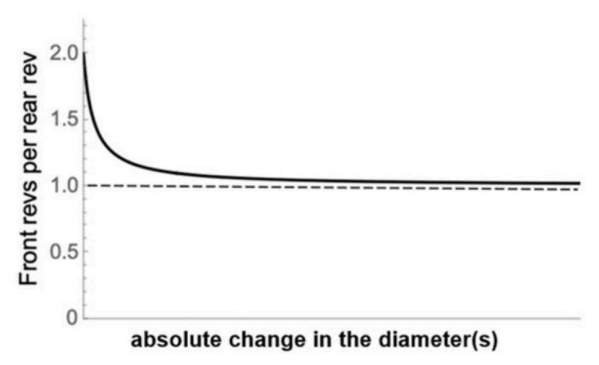
    So, when you plot y against x directly, it will follow a power law curve,

    which typically starts with a steep rise and gradually becomes less steep as x increases.

    Answer:

    The correct plot when y is plotted against x is (a).

    Similar Questions

    test-prime-package

    Access ‘CSIR NET- GENERAL APTITUDE’ Mock Tests with

    • 60000+ Mocks and Previous Year Papers
    • Unlimited Re-Attempts
    • Personalised Report Card
    • 500% Refund on Final Selection
    • Largest Community
    students-icon
    368k+ students have already unlocked exclusive benefits with Test Prime!
    Our Plans
    Monthsup-arrow