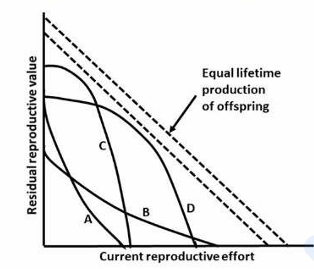
Correct option is B
Curves A and B Concept:
Reproductive strategies are the methods by which organisms allocate resources towards reproduction. Two primary strategies are:
Semelparity:
Organisms that exhibit semelparity reproduce only once in their lifetime. They invest all their energy and resources into a single, often massive reproductive event. After reproduction, these organisms typically die.
Examples: Pacific salmon, which migrate upstream to spawn before dying; annual plants that produce seeds and die after one growing season.Iteroparity:
Organisms exhibiting iteroparity reproduce multiple times throughout their lives, often at regular intervals. They allocate resources to both current reproduction and future reproductive opportunities.
Examples: Most mammals, birds, and perennial plants that flower and produce seeds multiple times over their lifetimes.
Explanation:
Curve A:
Represents a steep decline in future reproductive value as current reproductive effort increases. This curve is indicative of semelparous organisms that invest heavily in a single reproductive event, leading to a loss of future potential.Curve B:
Shows a decrease in future reproductive value with increased current effort, although it may be less pronounced than Curve A. This curve still suggests that high reproductive investment can lead to diminished future reproductive opportunities, aligning with the semelparous strategy.Curve C:
As current reproductive effort increases, the future reproductive value remains relatively stable or decreases minimally. This suggests iteroparity, where organisms can balance current and future reproduction effectively.Curve D:
Similar to Curve C, it suggests a minimal trade-off between current and future reproductive efforts, further supporting iteroparity.