hamburger menu
All Coursesall course arrow
adda247
reward-icon
adda247
    arrow
    arrow
    arrow
    In the application of Chi-square distribution for test of association between two characteristics, arrange the following steps in correct sequence
    Question


    In the application of Chi-square distribution for test of association between two characteristics, arrange the following steps in correct sequence
    (i) Compare the calculated value of X²-statistic with the tabulated value (ii) Set up the Null Hypothesis (iii) Tabulate data in the contingency table (iv) Divide square difference of expected frequency from observed frequency and add the values at each data point (v) Calculate the expected frequencies
    Choose the most appropriate answer from the options given below:

    A.

    iv, ii, iii, v, i

    B.

    ii, iii, v, iv, i

    C.

    ii, iii, iv, v, i

    D.

    i, ii, iii, v, iv

    Correct option is B


    The steps for applying the Chi-square test of association are as follows:
    1. (b) Set up the Null Hypothesis:
    · Formulate the null hypothesis (H₀) stating there is no association between the two characteristics being tested.
    2. (c) Tabulate data in the contingency table:
    · Organize the observed frequency data into a contingency table.
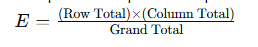
    3. (E) Calculate the expected frequencies:
    · Compute the expected frequencies using the formula:

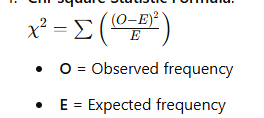
    4. (d) Divide square difference of expected frequency from observed frequency and add the values at each data point:
    · For each cell, calculate:

    · Sum up all the calculated values.
    5. (a) Compare the calculated value of X²-statistic with the tabulated value:
    · Compare the calculated Chi-square value to the critical (tabulated) Chi-square value to decide whether to reject or fail to reject the null hypothesis.
    Thus, the correct sequence is B, C, E, D, A.
    Information Booster 1. Chi-square Test:
    · Used to test the independence of two categorical variables in a contingency table.
    2. Null Hypothesis (H₀):
    · Assumes no association between the variables.
    3. Expected Frequency:
    · The theoretical frequency you would expect in each cell if the null hypothesis is true.
    4. Chi-square Statistic Formula:

    5. Degrees of Freedom (df):
    · For a contingency table, calculated as: df=(r−1)×(c−1)
    · r = Number of rows
    · c = Number of columns
    Additional Knowledge · (a) Compare the calculated value: This is the final step to determine if the result is statistically significant.
    · (b) Set up the Null Hypothesis: Hypothesizing no relationship between the variables.
    · (c) Tabulate Data: Organizing the observed data systematically.
    · (d) Square Difference Calculation: This step is the essence of calculating the Chi-square value.
    · (E) Calculate Expected Frequencies: These provide the baseline for comparison with observed frequencies.

    Free Tests

    Free
    Must Attempt

    Basics of Education: Pedagogy, Andragogy, and Hutagogy

    languageIcon English
    • pdpQsnIcon10 Questions
    • pdpsheetsIcon20 Marks
    • timerIcon12 Mins
    languageIcon English
    Free
    Must Attempt

    UGC NET Paper 1 Mock Test 1

    languageIcon English
    • pdpQsnIcon50 Questions
    • pdpsheetsIcon100 Marks
    • timerIcon60 Mins
    languageIcon English
    Free
    Must Attempt

    Basics of Education: Pedagogy, Andragogy, and Hutagogy

    languageIcon English
    • pdpQsnIcon10 Questions
    • pdpsheetsIcon20 Marks
    • timerIcon12 Mins
    languageIcon English

    Similar Questions

    test-prime-package

    Access ‘UGC NET EVS’ Mock Tests with

    • 60000+ Mocks and Previous Year Papers
    • Unlimited Re-Attempts
    • Personalised Report Card
    • 500% Refund on Final Selection
    • Largest Community
    students-icon
    368k+ students have already unlocked exclusive benefits with Test Prime!
    Our Plans
    Monthsup-arrow