arrow
arrow
arrow
​In a study comparing different plant communities (A to D) across a landscape, the following data were obtained:Community ABCDNo. of species in the
Question


In a study comparing different plant communities (A to D) across a landscape, the following data were obtained:

Community

A

B

C

D

No. of species in the community

12

25

11

19

No. of species common to both communities

Community

A

B

C

D

A


9

8

10

B


6

14

C


7

D


Which of the following options represents the pair of communities with the highest similarity value when Sorenson’s coefficient is used?


A.

A and C

B.

A  and  D

C.

B and C

D.

B and D

Correct option is A


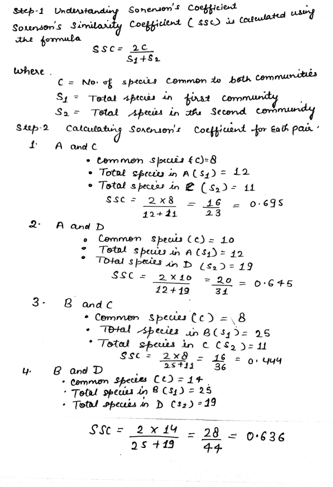
Step 3: Determining the Highest Similarity Value

  • A and C: 0.695(Highest)
  • A and D: 0.645
  • B and C: 0.444
  • B and D: 0.636

Information Booster:

  1. Sorenson’s Coefficient measures community similarity, giving higher weight to shared species.
  2. It ranges between 0 (no similarity) and 1 (complete similarity).
  3. More shared species = Higher similarity index.
  4. Lower species richness with high overlap results in higher SSC values.
  5. Used in ecological studies to compare biodiversity across different habitats.

Similar Questions

test-prime-package

Access ‘CSIR NET Life Sciences’ Mock Tests with

  • 60000+ Mocks and Previous Year Papers
  • Unlimited Re-Attempts
  • Personalised Report Card
  • 500% Refund on Final Selection
  • Largest Community
students-icon
383k+ students have already unlocked exclusive benefits with Test Prime!
Our Plans
Monthsup-arrow