


Correct option is A
Correct Answer: (a)
Explanation:
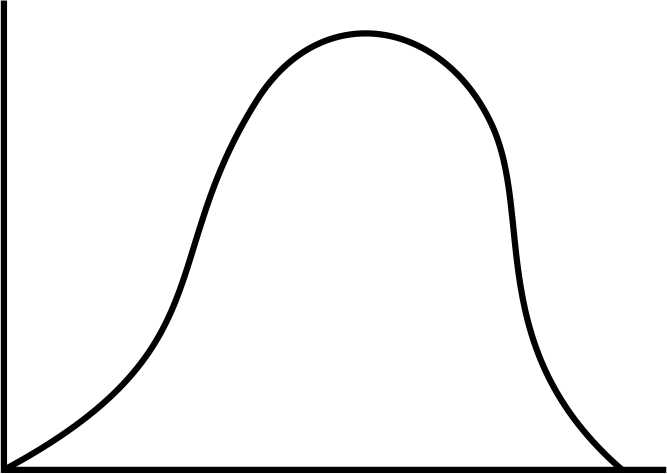
Polygenic inheritance (many genes contributing small additive effects) produces a continuous range of phenotypes that, with many loci and random segregation, approximates a normal (bell-shaped) distribution of phenotypic classes in the offspring — represented by Graph (1).
Information Booster:
Each gene adds or subtracts a small effect → many intermediate phenotypes.
With increasing number of loci, the distribution tends toward a Gaussian curve (central limit theorem).
Examples of polygenic traits: human height, skin colour, weight.
The more loci involved, the smoother and more continuous the distribution.
Environmental variation further smooths the phenotypic distribution.
Additional Information (Incorrect Options):
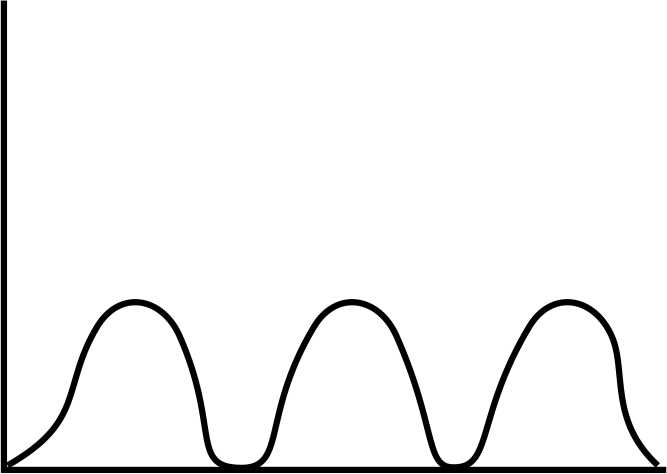
(b) Multimodal peaks suggest discrete classes or segregating major genes (not typical of many additive genes).
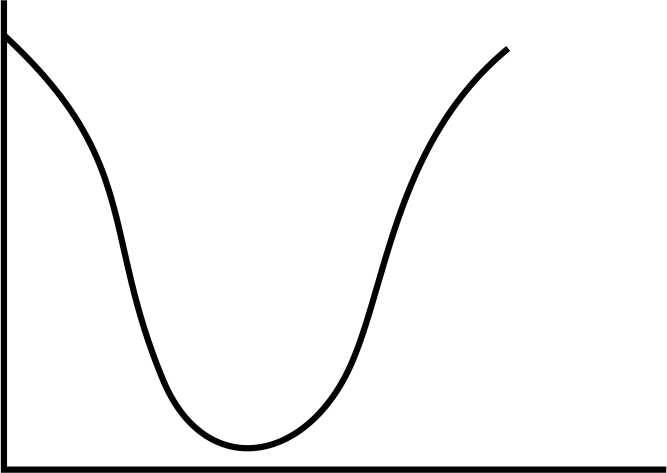
(c) Bimodal/trough patterns indicate disruptive segregation or major gene effects, not polygenic additive inheritance.
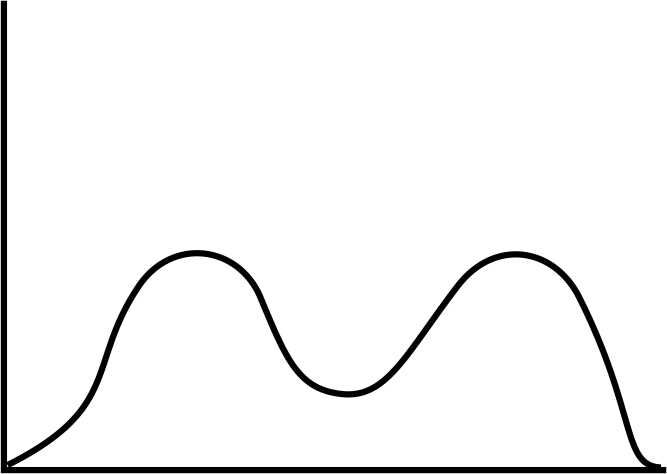
(d) Multiple small peaks with no normal shape imply mixture of distinct discrete classes or poor sampling — not the expected polygenic normal distribution.
 English
 150 Questions
 150 Marks
 150 Mins

