Correct option is C
Solution:
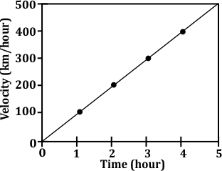
In the graph provided, the y-axis represents velocity, and the x-axis represents time. Analyzing each interval's behavior, we get:
· From t = 0 to t = 10s, the object is moving with a constant velocity (20 m/s).
· From t = 10s to t = 20s, the object is decelerating, as its velocity is decreasing uniformly.
· From t = 20s to t = 30s, the velocity is zero, meaning the object is at rest.
· From t = 30s to t = 40s, the object is moving with a constant velocity (-20 m/s) but in the opposite direction compared to the initial direction.
· From t = 40s to t=50s, the object's velocity is decreasing (in the negative direction), implying it is accelerating in the negative direction.
Given this analysis, the correct answer to the question is:
A) The object is moving with constant velocity. This is NOT correct. The object moves with a constant velocity only during specific time intervals, not throughout the entire period.
B) The object covers equal distance every hour. This is also NOT correct. The object's speed varies considerably during different intervals, and therefore, it won't cover an equal distance every hour.
C) The object is accelerating. This statement is CORRECT. The object does accelerate during the time interval from t=40s to t=50s as the velocity changes uniformly.