arrow
arrow
arrow
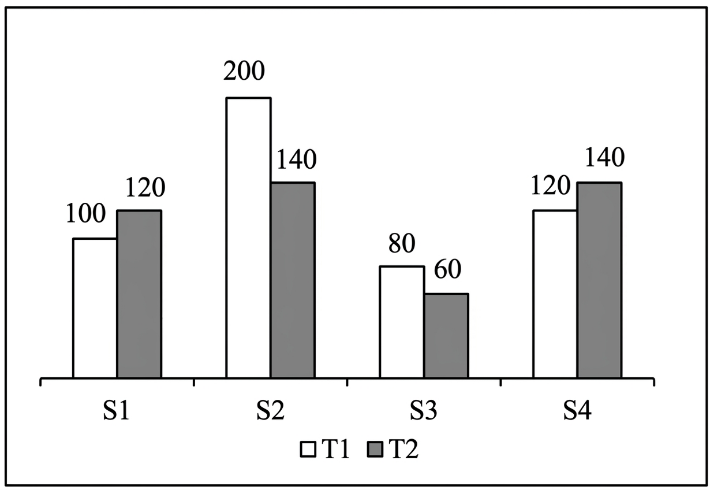
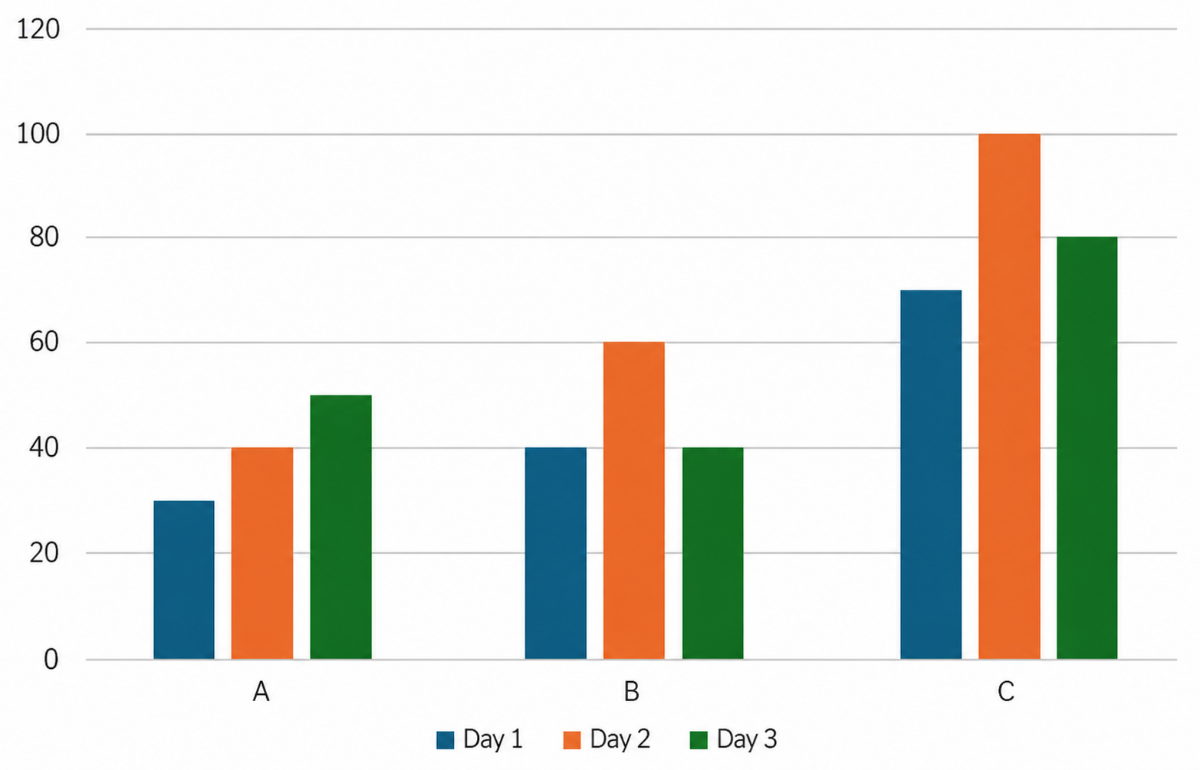
Given below is a bar graph for Companies A, B, and C showing their incomes over three days (amounts in ₹ thousand). Study the bar graph and answer the
Question

Given below is a bar graph for Companies A, B, and C showing their incomes over three days (amounts in ₹ thousand). Study the bar graph and answer the question that follows.

What is Company C’s income (in ₹) on Day 2?

A.

2,00,000

B.

1,00,000

C.

3,00,000

D.

4,00,000

Correct option is B

Given:
A bar graph displaying incomes of Companies A, B, and C over three days in thousands.
Formula Used:
Direct reading from the bar graph.
Solution:
From the bar graph, the value corresponding to Company C on Day 2 is 100 thousand.
Income in absolute terms = 100 × 1000 = 100000
Final Answer
So the correct answer is (b)

Free Tests

Free
Must Attempt

SSC GD Constable Exam Day Based Mock 1

languageIcon English
  • pdpQsnIcon80 Questions
  • pdpsheetsIcon160 Marks
  • timerIcon60 Mins
languageIcon English
Free
Must Attempt

Mathematics Section Test 1

languageIcon English
  • pdpQsnIcon20 Questions
  • pdpsheetsIcon40 Marks
  • timerIcon25 Mins
languageIcon English
Free
Must Attempt

SSC CGL T-I Full Mock Test 1

languageIcon English
  • pdpQsnIcon100 Questions
  • pdpsheetsIcon200 Marks
  • timerIcon60 Mins
languageIcon English

Similar Questions

test-prime-package

Access ‘DSSSB Multi tasking staff’ Mock Tests with

  • 60000+ Mocks and Previous Year Papers
  • Unlimited Re-Attempts
  • Personalised Report Card
  • 500% Refund on Final Selection
  • Largest Community
students-icon
533k+ students have already unlocked exclusive benefits with Test Prime!

Similar Questions

Our Plans
Monthsup-arrow