Correct option is A
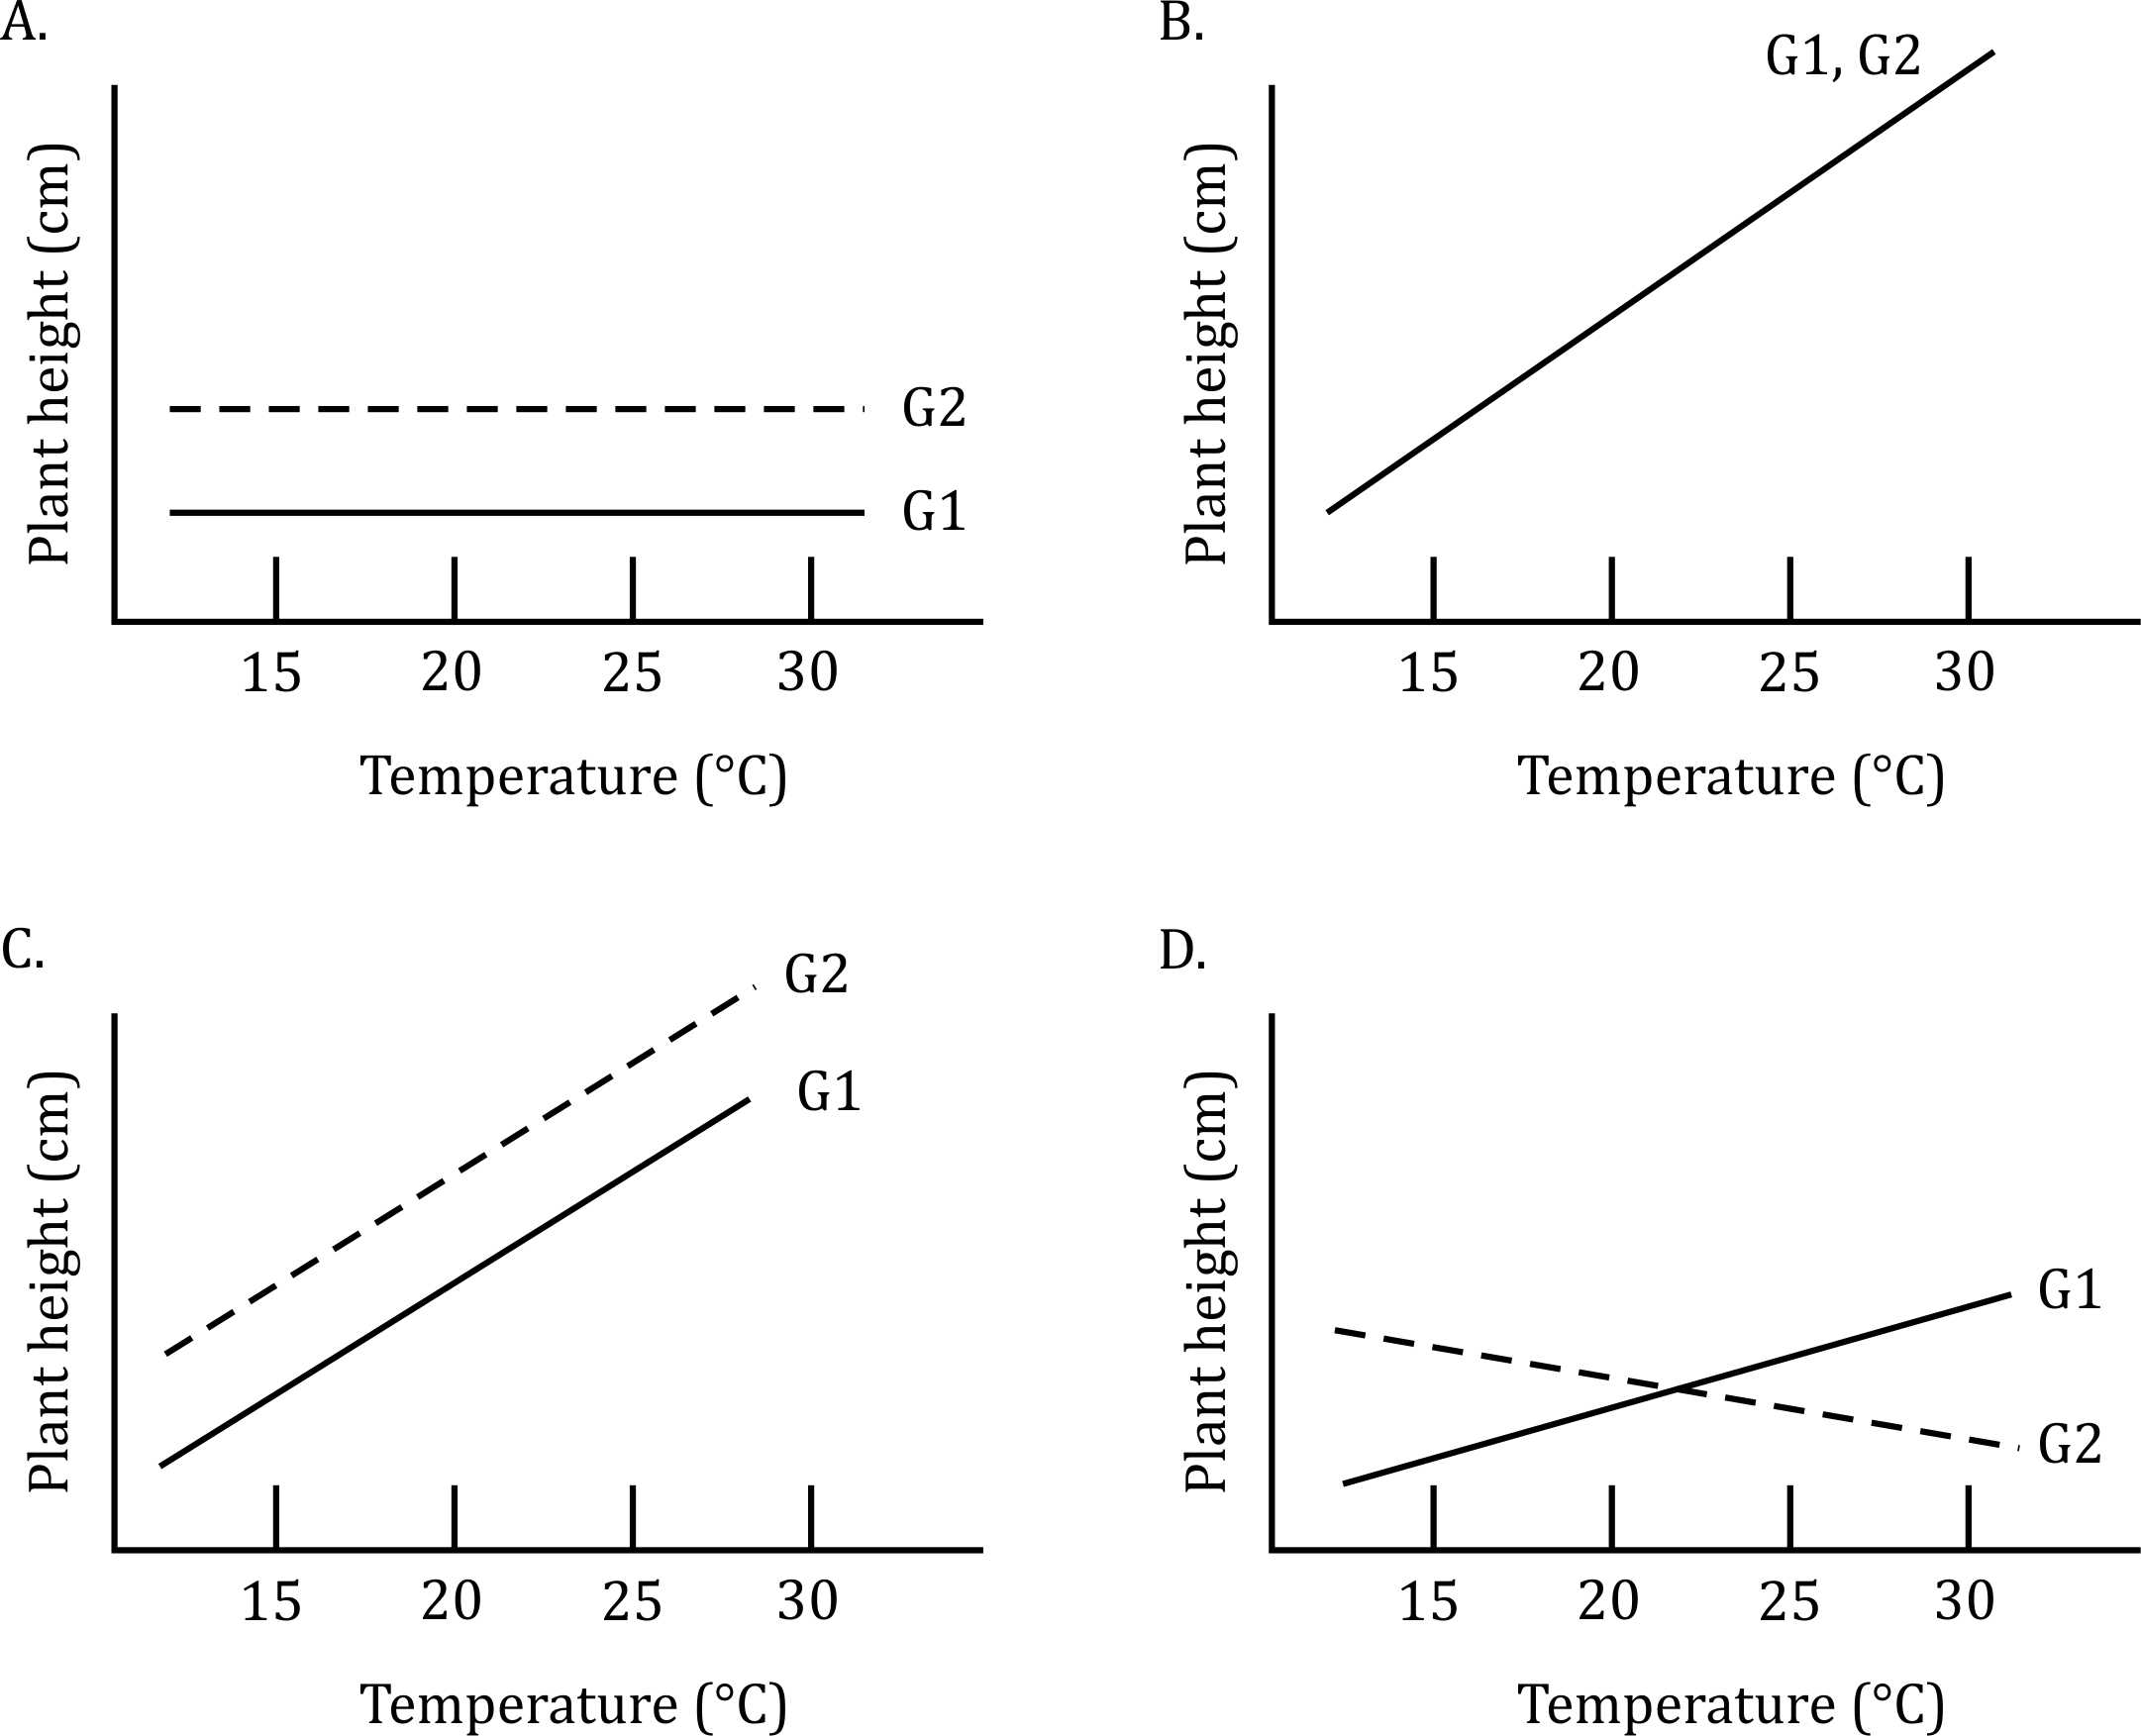
Each graph represents a different scenario of how plant height is influenced by genotype (G1, G2) and environmental factors (temperature). Let's analyze them one by one:
Figure A:
- The plant height remains constant across temperature changes for both G1 and G2.
- This suggests that genotype alone determines plant height, and the environment (temperature) has no effect.
- This matches Statement i: "Plant height is influenced primarily by the genotype of the two varieties."
- Thus, A → i
Figure B:
- The plant height increases with temperature, and both genotypes (G1, G2) respond in the same way (overlapping solid and dashed lines).
- This means only temperature influences plant height, and genotype has no effect.
- This matches Statement ii: "Variation in plant height is influenced only by temperature, and genotype has no effect."
- Thus, B → ii
Figure C:
- Both G1 and G2 show an increase in plant height as temperature increases, but the two lines remain separate.
- This means both genotype and temperature contribute to plant height in an additive manner (i.e., no interaction but both factors matter).
- This matches Statement iii: "Genotype and temperature collectively have an additive effect on plant height."
- Thus, C → iii
Figure D:
- G1 and G2 respond differently to changes in temperature—one increases while the other decreases.
- This indicates a genotype-environment interaction, where both factors affect plant height, but the response to temperature differs between genotypes.
- This matches Statement iv: "Both genotype and environment have an effect on plant height, with the two varieties responding differently to the environment."
- Thus, D → iv