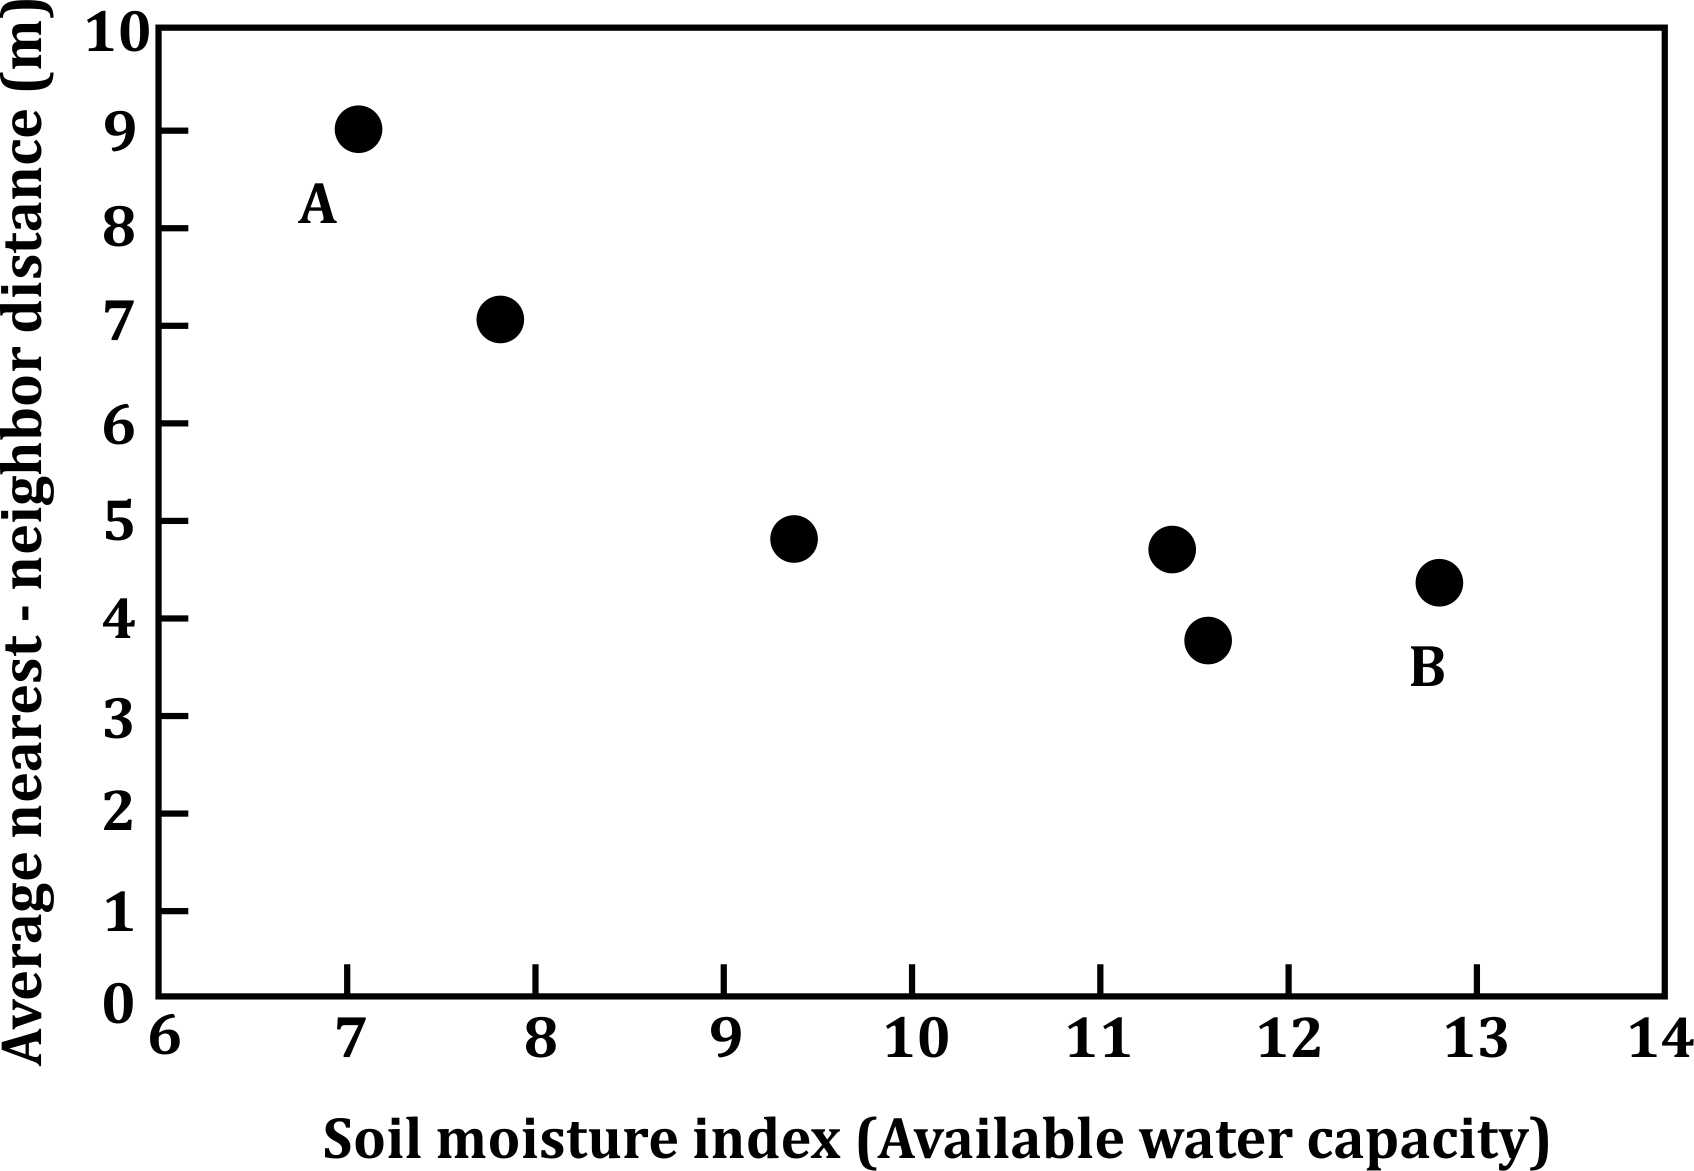
Correct option is D
The plot demonstrates two distinct populations labeled "A" and "B." Looking at their distribution:
- Population A appears to be spaced more regularly, with relatively consistent distances between its data points. This suggests a regular dispersion pattern for population A.
- Population B also shows a pattern where the data points are consistently spread apart, indicating a regular dispersion pattern for population B as well.
In ecological studies, a regular distribution typically suggests that competition for resources is influencing the spacing of individuals, where individuals are spaced out more evenly to avoid direct competition with neighbors.
Information Booster:
- Regular Dispersion: Both populations A and B show a regular dispersion pattern, where individuals tend to be evenly spaced apart. This typically occurs due to intense competition for resources such as water and nutrients.
- Ecological Implication: Regular distribution often occurs when environmental factors or species interactions drive individuals to maximize resource use by minimizing overlap with neighbors.
- Competition for Resources: In this case, the competition for below-ground resources such as water could drive individuals to maintain a specific distance from each other, leading to regular spacing.
- Other Dispersion Patterns: The plot rules out clumped or random distributions, where individuals would be more clustered together or scattered without a specific pattern.
- Population Density and Resource Availability: In areas with higher resource availability, you might observe a random distribution. In this scenario, the lack of such clustering suggests higher competition or resource scarcity, leading to a more regular pattern.
- Comparing A and B: Both populations A and B exhibit similar dispersion patterns, making option 4, A-Regular and B-Regular, the most suitable answer.
Additional Information:
- Option 1 (A-Regular and B-Random): This option would imply that population B has a random distribution. However, the data points for population B show a relatively even spacing, suggesting a regular distribution, making this option incorrect.
- Option 2 (A-Random and B-Clumped): This would suggest that A has a random distribution and B has a clumped distribution. However, both populations show relatively consistent spacing, ruling out this option.
- Option 3 (A-Clumped and B-Regular): This would suggest that A is clumped, which doesn't match the data shown in the plot, as A's points are evenly spaced, ruling out this option.