Correct option is B
Step-by-Step Explanation:
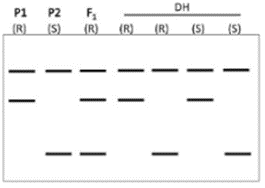
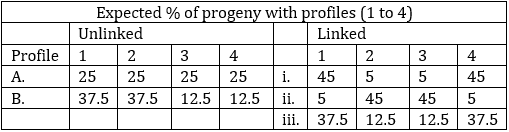
The Table from Image 1:
This table provides the expected percentage of progeny with four profiles (1 to 4) for two scenarios:
Unlinked: When the DNA marker is unlinked to the gene controlling the trait.
Linked (10 cM): When the DNA marker is linked to the gene controlling the trait at a distance of 10 cM.
The values for these two scenarios are proposed for two different genetic scenarios (A and B) that describe the proportions of the four profiles of DH progeny.
Interpretation of the Answer Options:
Option A: A, ii
This suggests that for "Unlinked" and "Linked" markers, the expected percentages are as given in Scenario A for unlinked and Scenario ii for linked.
Option B: A, i
This suggests that the expected progeny percentages for Scenario A for unlinked markers and Scenario i for linked markers.
Option C: B, i
This suggests that the expected progeny percentages are from Scenario B for unlinked markers and Scenario i for linked markers.
Option D: A, iii
This suggests that the expected progeny percentages are from Scenario A for unlinked markers and Scenario iii for linked markers.
Correct Answer:
The correct answer is Option B (A, i).